Citation: | Yu Wu, Matthew F. Webster, Brian Joy, Steve Beyer, David Kunar, et al. Combined Purification and Crystal Growth of CsPbBr3 by Modified Zone Refining. Materials Lab 2022, 1, 220019. doi: 10.54227/mlab.20220019 |
The all-inorganic semiconducting perovskite Cesium Lead Bromide, CsPbBr3, exhibits promising properties for ionizing radiation detection applications. In this work, polycrystalline CsPbBr3 was synthesized from the melt of binary compounds CsBr and PbBr2. Moisture and oxides in the synthesized CsPbBr3 compounds were removed by a reduction process under hydrogen. The CsPbBr3 materials were purified and grown into high-quality single crystals
Room-temperature semiconducting ionizing radiation detectors have been applied in many different fields, such as medical imaging, national security, and scientific research.[1-3] Effective semiconductor radiation detectors must satisfy a number of requirements, including a high density and high effective atomic number, to achieve a high radiation stopping power, as well as a large bandgap and high resistivity to suppress the thermal excitation of charge carriers.[4] To achieve high charge collection efficiency during the radiation detection process, the mobility-lifetime product (μτ) of the detector material plays an important role. A higher μτ guarantees a longer mean drift length (λ) under a given electric field, leading to an effective collection of photo-generated charges.[5]
Researchers have investigated and developed several high-performance compound semiconductor detectors such as cadmium zinc telluride (CZT) and Thallium bromide (TlBr).[6-8] However, the commercial benchmark material, CZT, still suffers from a high concentration of Te inclusions/precipitates, uneven distribution of Cd and Te, and high production cost. [7, 9-11] TlBr detectors suffer from chemical instability and low hardness.[5, 12, 13] Therefore, it is important to explore alternative high-performance radiation detection materials suitable for low-cost, high-volume production.
The lead halide perovskites have received significant research attention for the past decade because of their excellent optoelectronic properties, such as high carrier mobility and long diffusion length. So far, these halides have been widely used in photodetectors, solar cells, as well as high-energy radiation detectors.[6, 14-19] Compared to the organic-inorganic hybrid perovskites, the all-inorganic perovskites show excellent mechanical stability, making them suitable for a broader range of applications.[20-22] As a prominent member of the inorganic halide perovskite family, cesium lead bromide (CsPbBr3), was first investigated as a radiation detector in 2013 by Stoumpos et al.[23] High-quality single-crystal detectors displaying excellent gamma-ray spectrometry response were prepared by He et al. in 2018.[24] CsPbBr3 possesses an effective atomic number of 65.9 (Zeff), giving rise to an excellent stopping power for gamma-ray photons; a large direct bandgap of 2.25 eV to prohibit leakage current; a high defects tolerance and a low melting point for easy crystal growth development. More importantly, CsPbBr3 shows a superior carrier mobility lifetime product for both electrons and holes, which facilitates its high radiation detection efficiency.[23-26] Compared to its poly- or nano-crystalline form, a bulk CsPbBr3 single crystal exhibits consistent bulk physical properties and better photo-electrical performances, as it is free of grain boundaries and less affected by extrinsic defects.[20, 27, 28] Thus, the growth of large, high-purity single crystals is crucial for the development of the CsPbBr3 material.
Currently, the state-of-the-art CsPbBr3 single crystals are obtained via multi-step processes involving separated reaction vessels and apparatuses.[26, 29-31] To achieve the high purity necessary for semiconducting detector operations,[5] the precursor materials, PbBr2 and CsBr, are usually purified separately and subsequently combined in a new reaction vessel for synthesis and crystal growth. Such processes place strict requirements for experimental technique and environmental control to prevent unintentional introduction action of trace impurity. In addition, the isolated purification, synthesis, and crystal growth protocols each have their thermal cycles (i.e., heating/cooling time), resulting in relatively low production efficiency. Hence, there is a need to develop more efficient purification and growth protocols for the development of CsPbBr3 based single crystal radiation detectors.
In this work, we report a modified zone-refining technique that combines the purification and the crystal growth of CsPbBr3 into a continuous process in a single reaction vessel. A set of reliable and reproducible procedures were developed to produce high-quality CsPbBr3 single crystals with excellent photosensitivity. The obtained CsPbBr3 crystals were subjected to compositional and trace element analyses to study the effect of minor stoichiometric imbalance. The optimized single crystal detectors were used to collect the pulse-height spectra of a radiation source.
The reagents and materials were used as acquired from commercial sources without further purification. (i)Lead (II) bromide, 99.999% (w.t.%, metals basis), Sigma-Aldrich; (ii) Cesium bromide, 99.999% (w.t.%, metals basis), Sigma-Aldrich; (iii) Methanol, Semiconductor Grade, 99.9% min, Alfa Aesar. (IV) PELCO® Conductive Silver Paint, TED PELLA. (V) Gallium metal, 99.999% (wt.% metals basis), Alfa Aesar.
Polycrystalline CsPbBr3 was synthesized from binary CsBr and PbBr2 precursors in a tapered fused quartz ampoule (25 mm OD, 22 mm ID and 350 mm length). The reaction vessel containing the sample was first heated to 120 ∘C under a dynamic vacuum for one hour to remove moisture and then heated at 570 ∘C for an hour under a slow-flowing hydrogen gas stream to complete the synthesis (Fig. 1a). The synthesized sample was cooled to room temperature under hydrogen and then flame-sealed under 0.3 atm of H2 pressure.
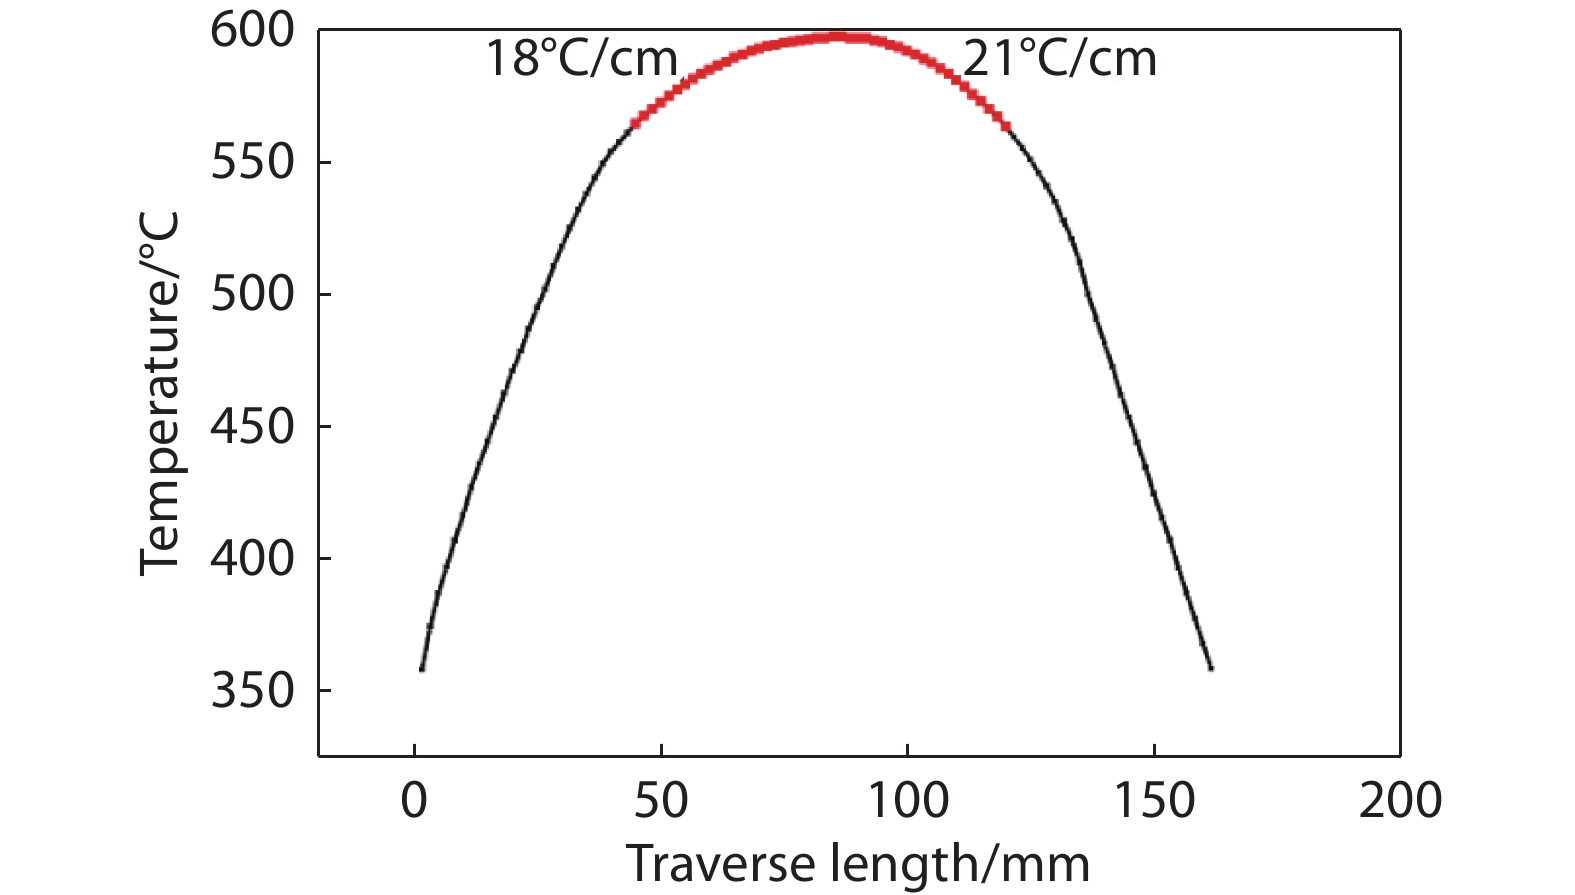
The sealed sample was subsequently subjected to zone-refining cycles. A tube furnace with a 4-inch heated zone was heated to a maximum temperature of 600 ∘C. The heater was moved along the length of the CsPbBr3-containing ampoule from the “tip” side to the “heel” side (Fig. 1b). The furnace movement was controlled at a speed of 10-20 mm/hour by a programmable linear motion system. Fig. 2 shows the temperature profile of a typical zone-refining cycle.
Upon completing each pass, the heater was quickly repositioned in front of the tip of the sample before the start of the next pass. After a number of zone-refining passes at a higher speed, the sample was subjected to slower passes to promote crystal growth. Table 1 shows the growth history of all samples discussed in this article. Three samples,
Sample | Zone refining | Pb/Cs molar ratio | Traverse speed |
No | 1.00: 1.00 | N/A | |
Yes | 1.00: 1.00 | 20 mm/h X 1, 5 mm/h X 4 | |
Yes | 1.02: 1.00 | 10 mm/h X 10, 5 mm/h X 1 | |
Yes | 1.00: 1.01 | 10 mm/h X2, 5 mm/h X3 |
The as-grown CsPbBr3 ingots obtained from the zone refining furnace were then sliced into 2-3 mm thick wafers by a precision saw with a 0.010 mm/s feeding rate (Struers Accutom-10). The sliced wafers were lapped and polished using an automatic Ecomet 30 polisher with SiC sandpapers of successively finer grits. The finely polished samples are approximately 1.5 mm in thickness. The roughness was measured by profilometer with 3 mg stylus force.
To identify the phase purity, as-grown single crystals were subjected to XRD analysis. About 2-3 mg of sample was ground to a fine powder and evenly placed on a zero background Si sample holder. XRD data were collected by using a Bruker D2 Phaser diffractometer using Cu Kα radiation (λ =
Trace impurity analysis in CsPbBr3 was performed by ICP-MS. Samples (~0.1 g of each) were dissolved with 2% HNO3 and deionized water at 85 °C on a hotplate and then sonicated to dissolution. Samples were measured for major and trace element concentrations by Thermo Scientific iCAPTM PRO inductively coupled plasma optical emission spectrometer (ICP-OES), and iCAPTM triple quadrupole inductively coupled plasma mass spectrometry (TQ ICP-MS). AQUA1, SLRS6 and NIST1643f certified reference materials were measured at regular time intervals (n=5 samples) throughout the sequence to ensure accuracy and reproducibility of the measurements. Sample replicates were also measured to ensure the reproducibility of measurements. Calibration standards were run throughout the sequence to check and correct for any potential drift. The TQ was operated in three modes: single quadrupole with no cell gas (Li, Be, B, Sc, Ti, V, Mn, Ni, Cu, Ga, Ge, Rb, Nb, Pd, Sb, Te, Ba, Ce, Pr, Nd, Re, Tl, Bi, U), single quadrupole in KED mode (He collision gas; Na, Mg, Al, Si, K, Ca, Fe, Co, Zn, Se, Zr, Mo, Ru, Rh, Ag, Cd, Sn, La, Sm, Eu, Dy, Ho, Er, Yb, Ta, W, Os, Ir, Pt, Au, Th) and triple-quadrupole with O2 as the reaction gas, utilizing mass shifting (P, S, Cr, As, Sr, Y, Gd, Tb, Tm, Lu, Hf).
WDS was used to accurately identify the elemental composition of different CsPbBr3 samples. The CsPbBr3 crystals were first embedded in epoxy to form round mounts 2.5 cm in diameter. Grinding was done using a Struers LaboPol-30 lapping instrument, resin-bonded diamond grinding discs (220, 500,
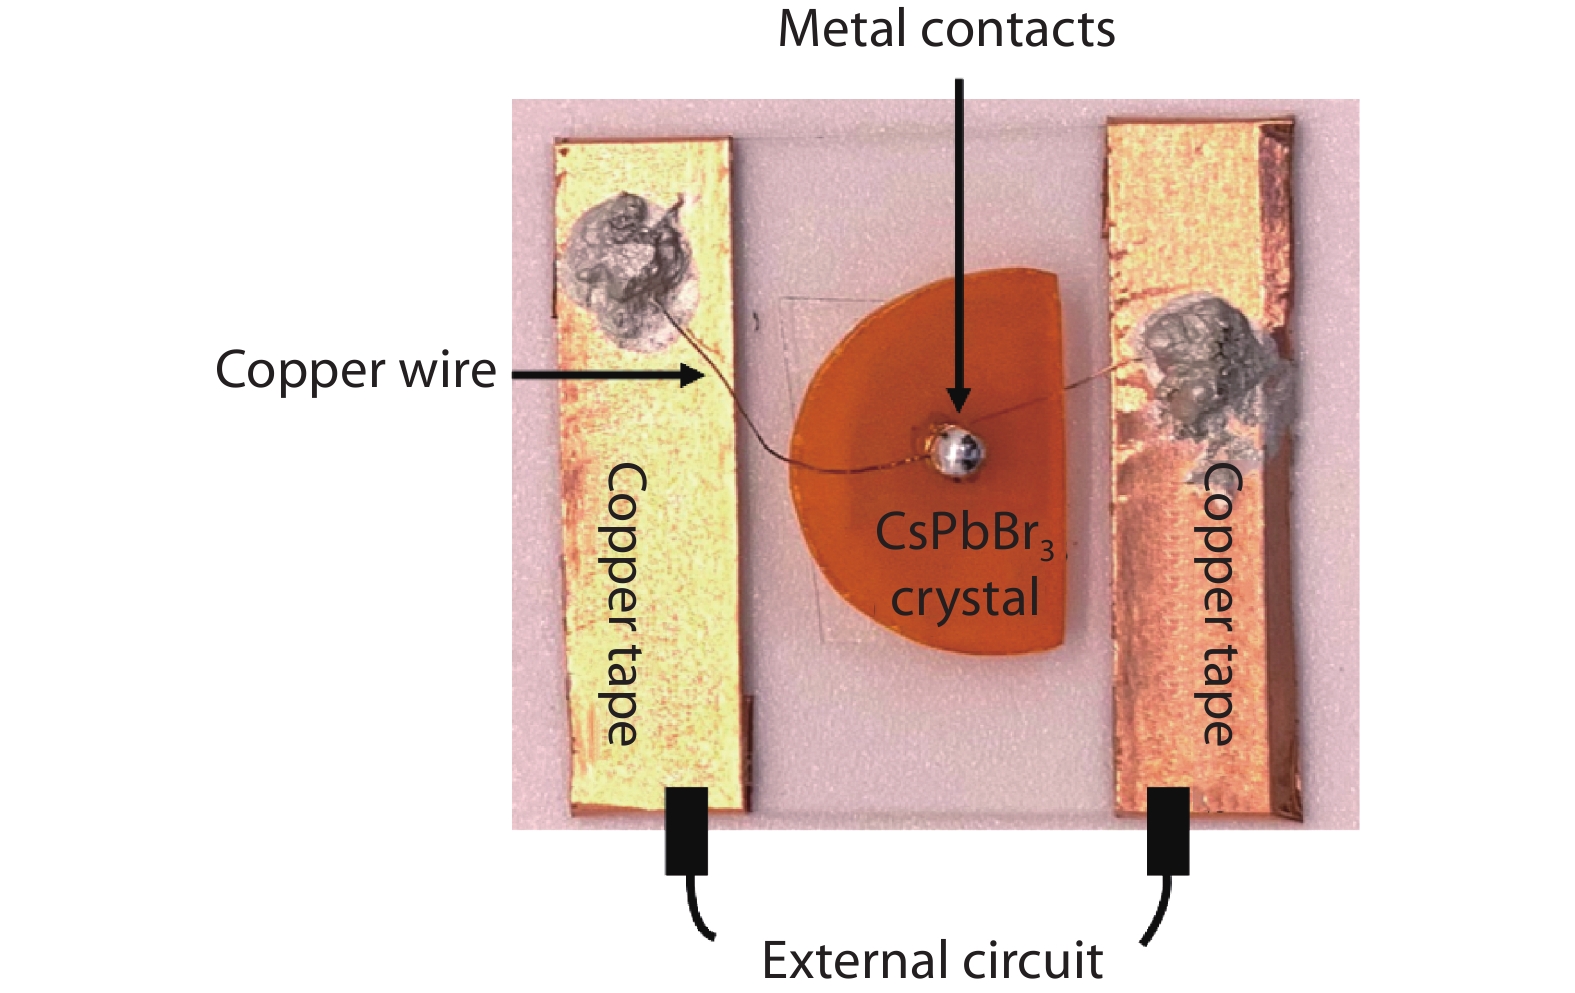
The CsPbBr3 detector devices were prepared by creating metal contacts on both sides of the polished crystals, shown in Fig. 3. The contacts were prepared by attaching colloidal silver paint or liquid gallium metal to the top and bottom surface of the crystal. Copper wire and tape were used to connect metal contacts to the external circuit. Similar to existing studies, the CsPbBr3 devices were placed in a dark metal box to block ambient light.[35] Characteristic current-voltage (I-V) curves were measured by connecting the device to a Keithley 6517b electrometer to control the external bias, and each recorded data point was an average of 10 measurements. Photosensitivity data was measured and collected over time under a constantly applied forward bias coupled with a blue LED light (20 mW) turning on and off at a set time interval inside a dark metal box. The photocurrent was recorded as a function of time.
Black impurity powder in the heel end of the crystal bulk after zone refining was collected and analyzed by a Renishaw InVia Raman Spectrometer to reveal the chemical composition and structure information. A 633 nm wavelength laser was used to probe the molecular vibrations of the sample. The sample was analyzed at 10% power, with an exposure time of 30 s, and three accumulations for each area were analyzed. A 50× objective was used to focus the laser onto the surface, and the spot size analyzed was ~1 μm in diameter. Seven spots in total were analyzed.
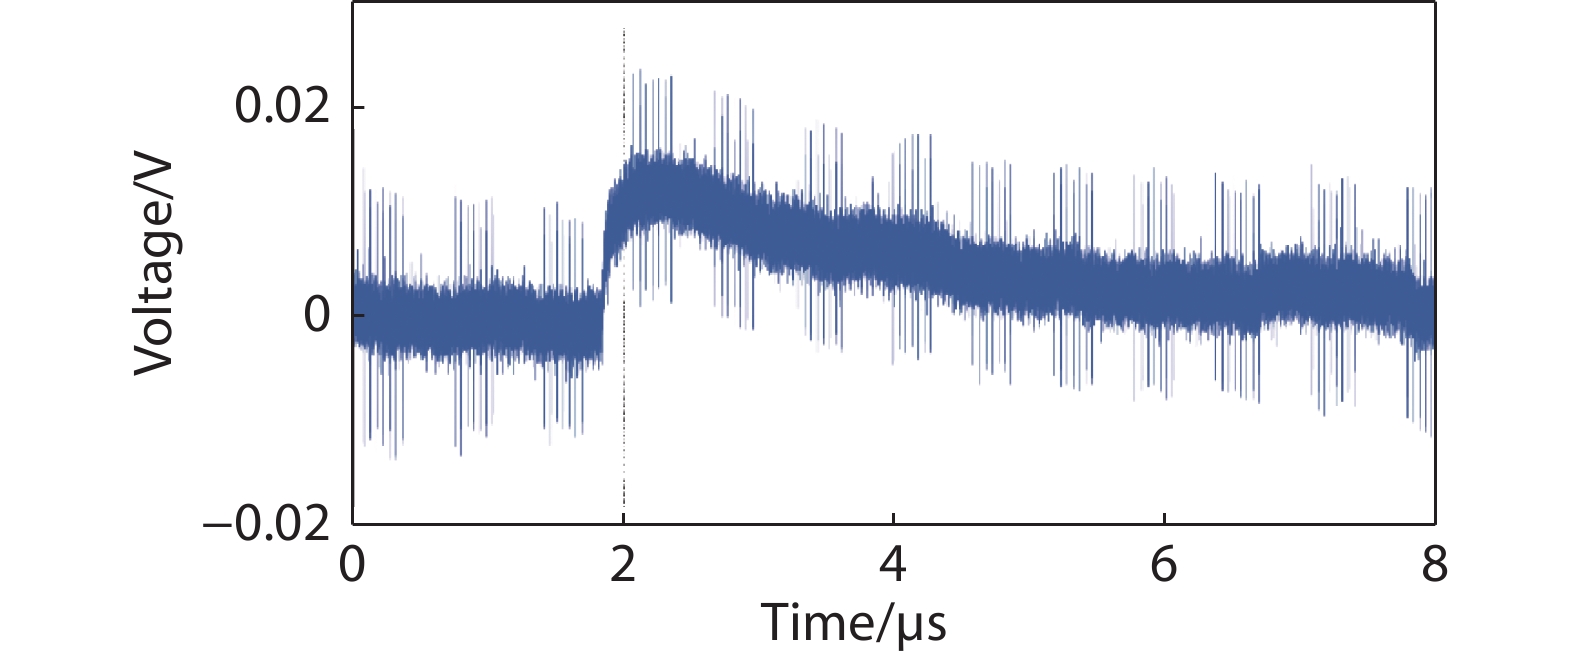
The pulse height spectra of a 241Am source were collected using a CsPbBr3 crystal device fabricated with a Ga\CsPbBr3\Ga contact configuration. The device was irradiated from the top in an electrically insulated dark box with a 0.9μCi 241Am source. The bottom Ga contact was connected to the ground and the top contact was connected to a Cr-Z-110-HV preamplifier from Cremat. The bias voltages used for the different trials were supplied by a Keithley 6517b electrometer. The preamplifier output was connected to a Red Pitaya STEMLab running MCA software. The data for each trial was collected for 15 min and used a sampling window of 4.1 μs.
The binary precursors, CsBr and PbBr2, were mixed and heated at 120 ∘C in the quartz ampoule under dynamic vacuum to remove moisture. Polycrystalline CsPbBr3 was then synthesized from the melt of the binaries under a slow-flowing hydrogen gas stream. During the synthesis, residual moisture, oxygen, and oxides in the CsPbBr3 samples were removed by the reductive hydrogen atmosphere. This reduction process is essential to prevent the sample degradation and ampoule failure caused by oxides.
The CsPbBr3 materials were purified by the faster zone-refining passes, while the slower final pass promotes the formation of large single crystals. Similar approaches were employed for the preparation of high purity TlBr single crystals.[36, 37] In contrast to TlBr, CsPbBr3 exhibits a much higher melting point leading to complex off-stoichiometry behaviours stemming from the volatility of the binary salt precursors.
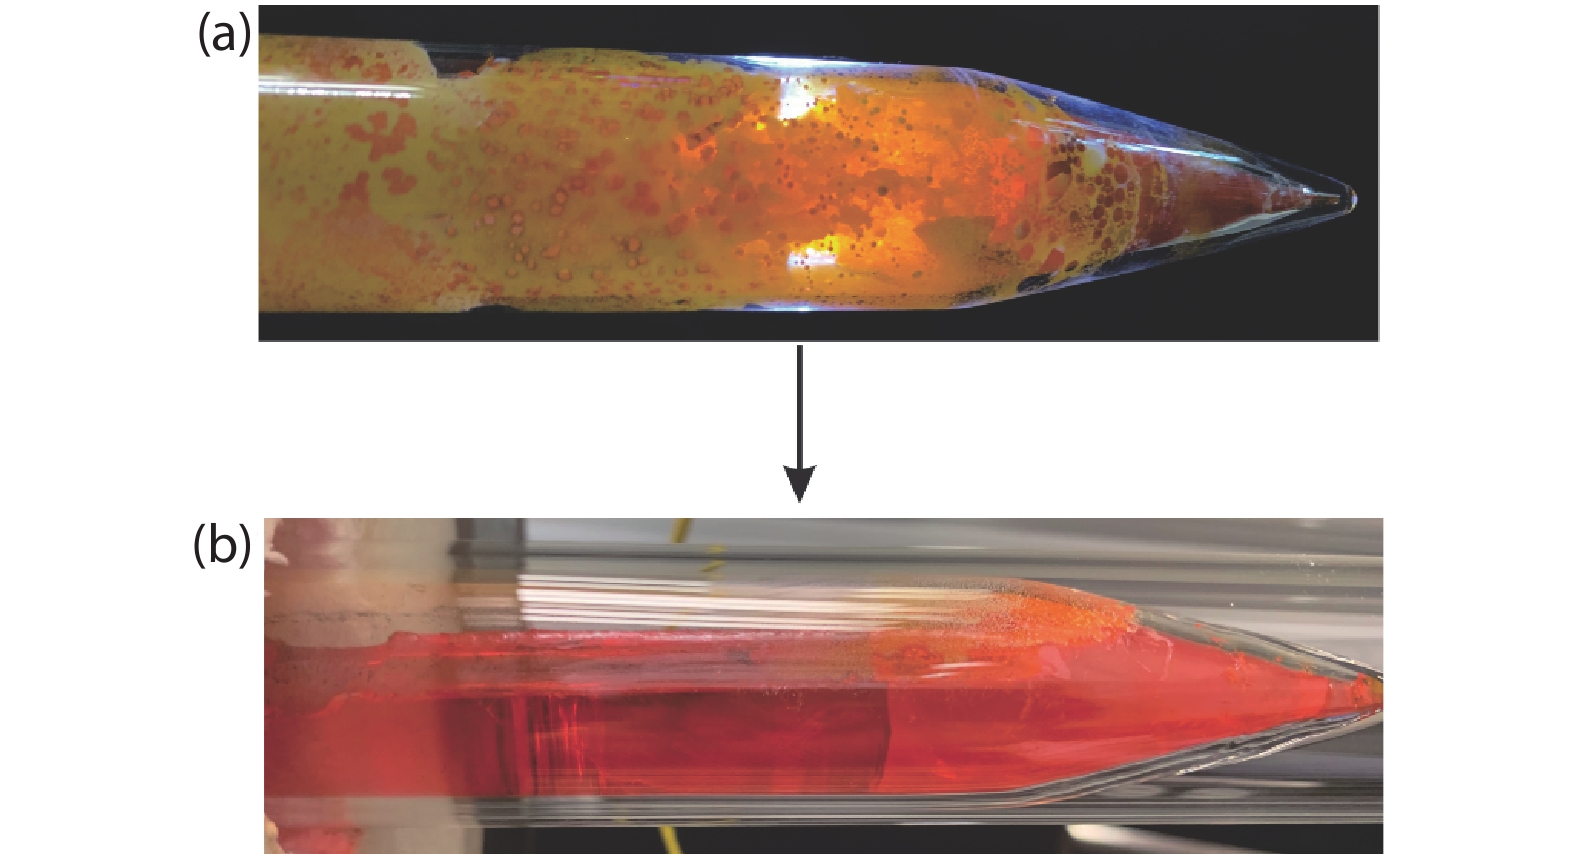
In earlier experiments, the pre-synthesized CsPbBr3 samples were sealed under a high vacuum of 1×10⁻⁴ mbar. During zone-refining, severe decomposition of CsPbBr3 was observed where binaries evaporated while heating, condensed and solidified on the ampoule after cooling down (Fig. 4a). WDS was used to identify the elemental composition of the solidified vapour particles, and the results are shown in Table 2. Two phases were detected, which were identified as PbBr2 and CsPb2Br5, respectively. The test data of phase 1 were normalized based on the mole fraction of Pb, and the data of phase 2 and other samples were normalized based on the mole fraction of Cs.
To suppress the volatilization of the precursors, we implemented a H2 gas back fill procedure, where the pre-synthesized CsPbBr3 was flame-sealed under 0.3 atm of H2 pressure. The 0.3 atm pressure was used because a higher amount of H2 would cause the flame sealing process to fail. This H2 pressure effectively controlled the vapour pressure in the ampoule and diminished the volatilization of the binary salts during the zone refining. With a better stoichiometry control, a uniform melt along the crystal bulk was achieved with no residual unmolten chunks (Fig. 4b). A small number of solidified particles were observed after zone refining under H2 pressure. These particles were characterized by XRD as pure CsPbBr3.
Sample | Elemental mole fraction | ||
Cs | Pb | Br | |
Phase 1 | 0.01 ± 0.02 | 1.00 ± 0.02 | 1.953 ± 0.009 |
Phase 2 | 1.000 ± 0.004 | 2.04 ± 0.01 | 5.11 ± 0.01 |
(*: It is worth noting that the WDS test for CsPbBr3 samples displayed slightly low analytical totals due to systematic errors in the matrix corrections.) |
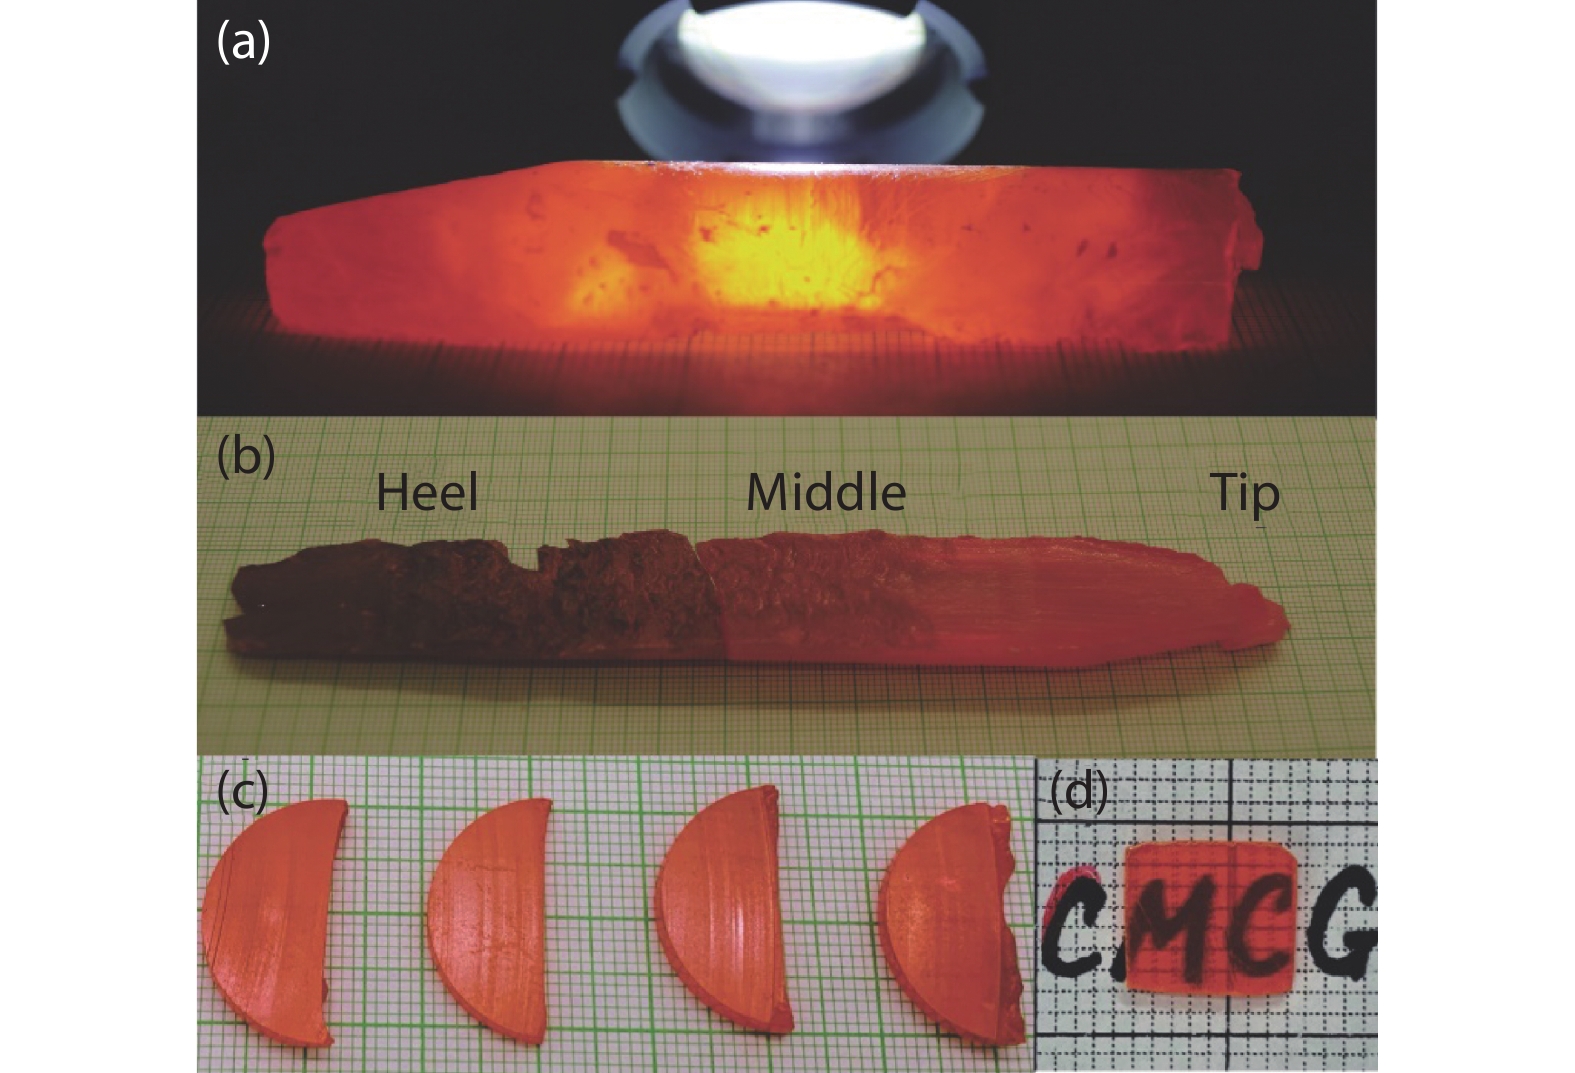
When the purification and crystal growth processes were completed, large single crystal CsPbBr3 sections were obtained. Along the direction of furnace movement, the tip and middle parts of the samples (first to freeze) appeared to be orange in colour and highly transparent. The heel sections (last to freeze) were darker to opaque-black in colour, demonstrating a strong accumulation of black impurity to the heel end (shown in Fig. 5a and 5b). The clear sections of the as-grown samples were processed by cutting (Fig. 5c) and polishing. The processed crystals displayed good transparency (Fig. 5d).
While the transparent samples were fabricated into detector devices for photo-electrical measurements, the dark, opaque parts were subjected to impurity analysis. Black impurity often appeared after samples completed the reduction process and zone refining. During the zone refining, black impurity accumulated to last-to-freeze and segregated at the heel end of the sample. Based on the chemical behaviour of the black impurity, we suspected it mainly consists of carbon from the decomposition of organic solvent residue in the precursors.[29]
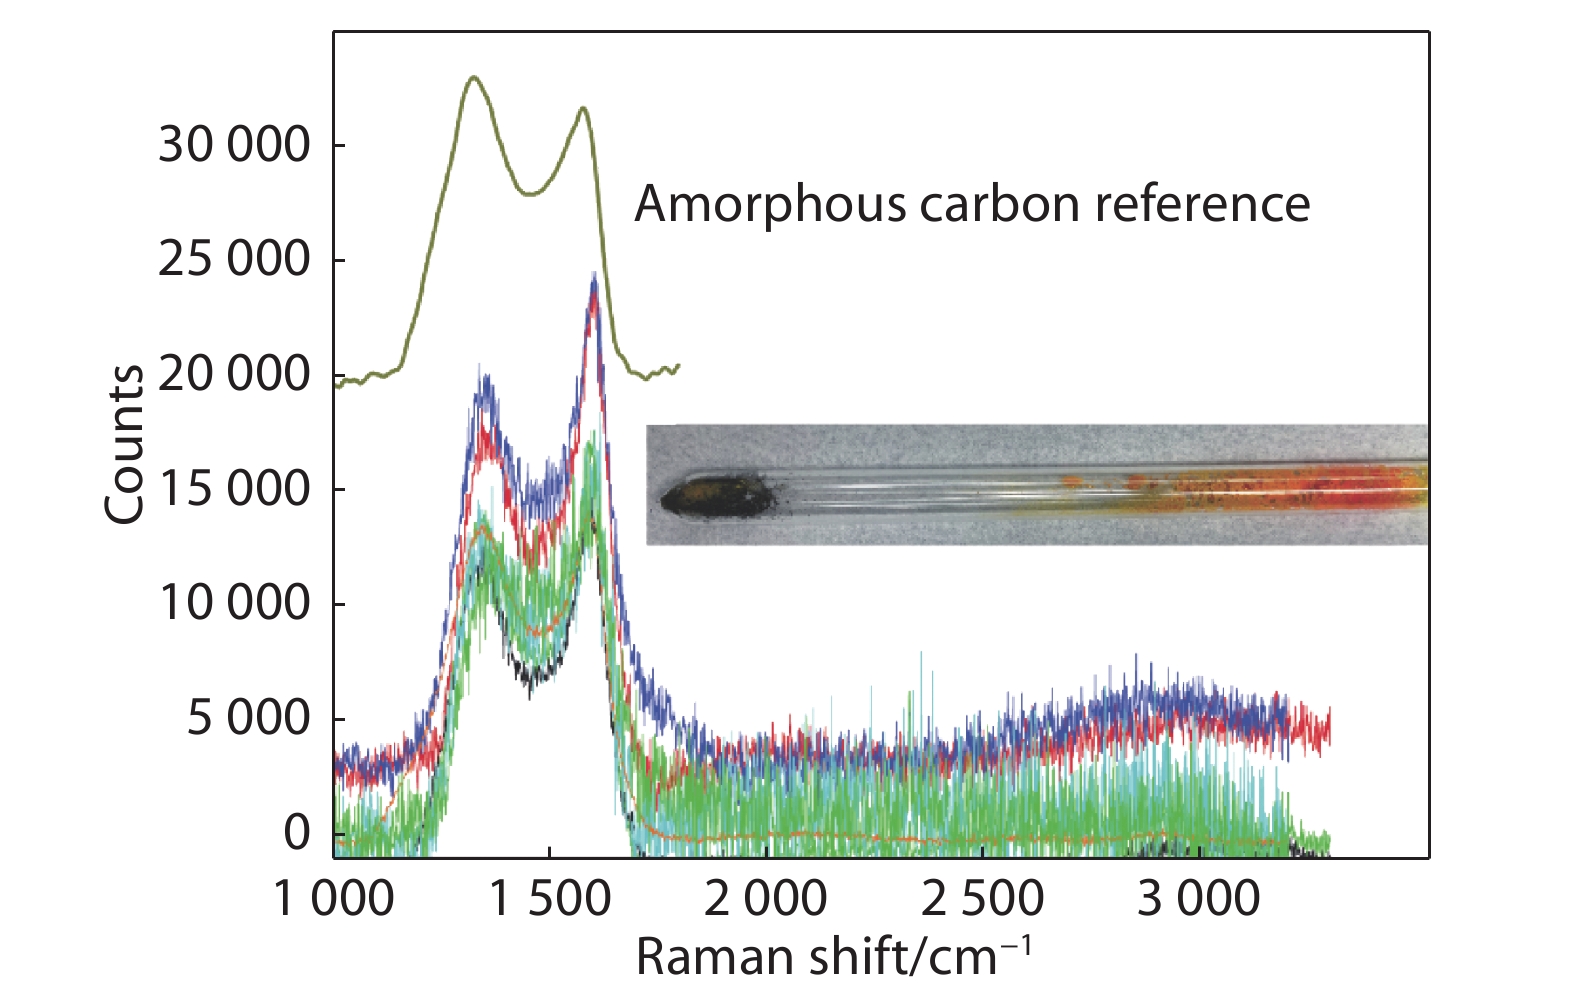
To isolate the black impurity from CsPbBr3 material, a vacuum sublimation of the heel pieces was performed (Fig. 6 insert). Isolated black impurity powder was collected and subjected to Raman spectroscopy analysis to identify its composition and structure. Seven spots were investigated, and the corresponding spectra were normalized to the same peak height. As Fig. 6 shows, all seven spots contain peaks at
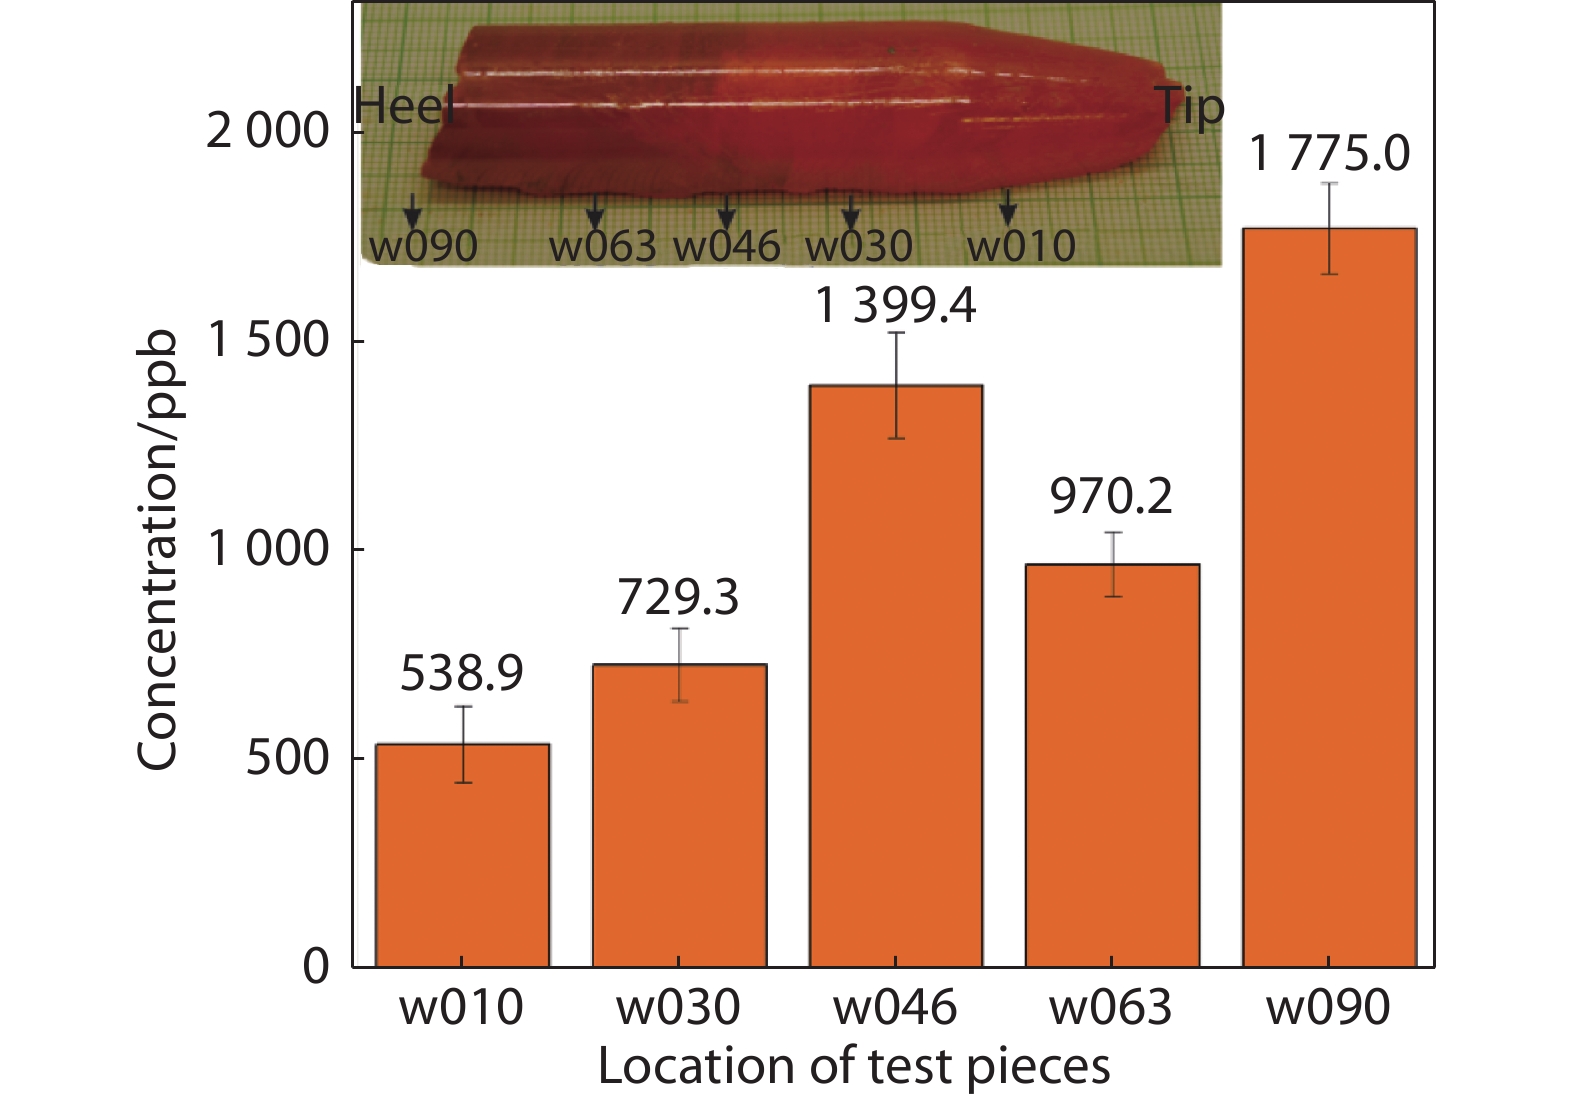
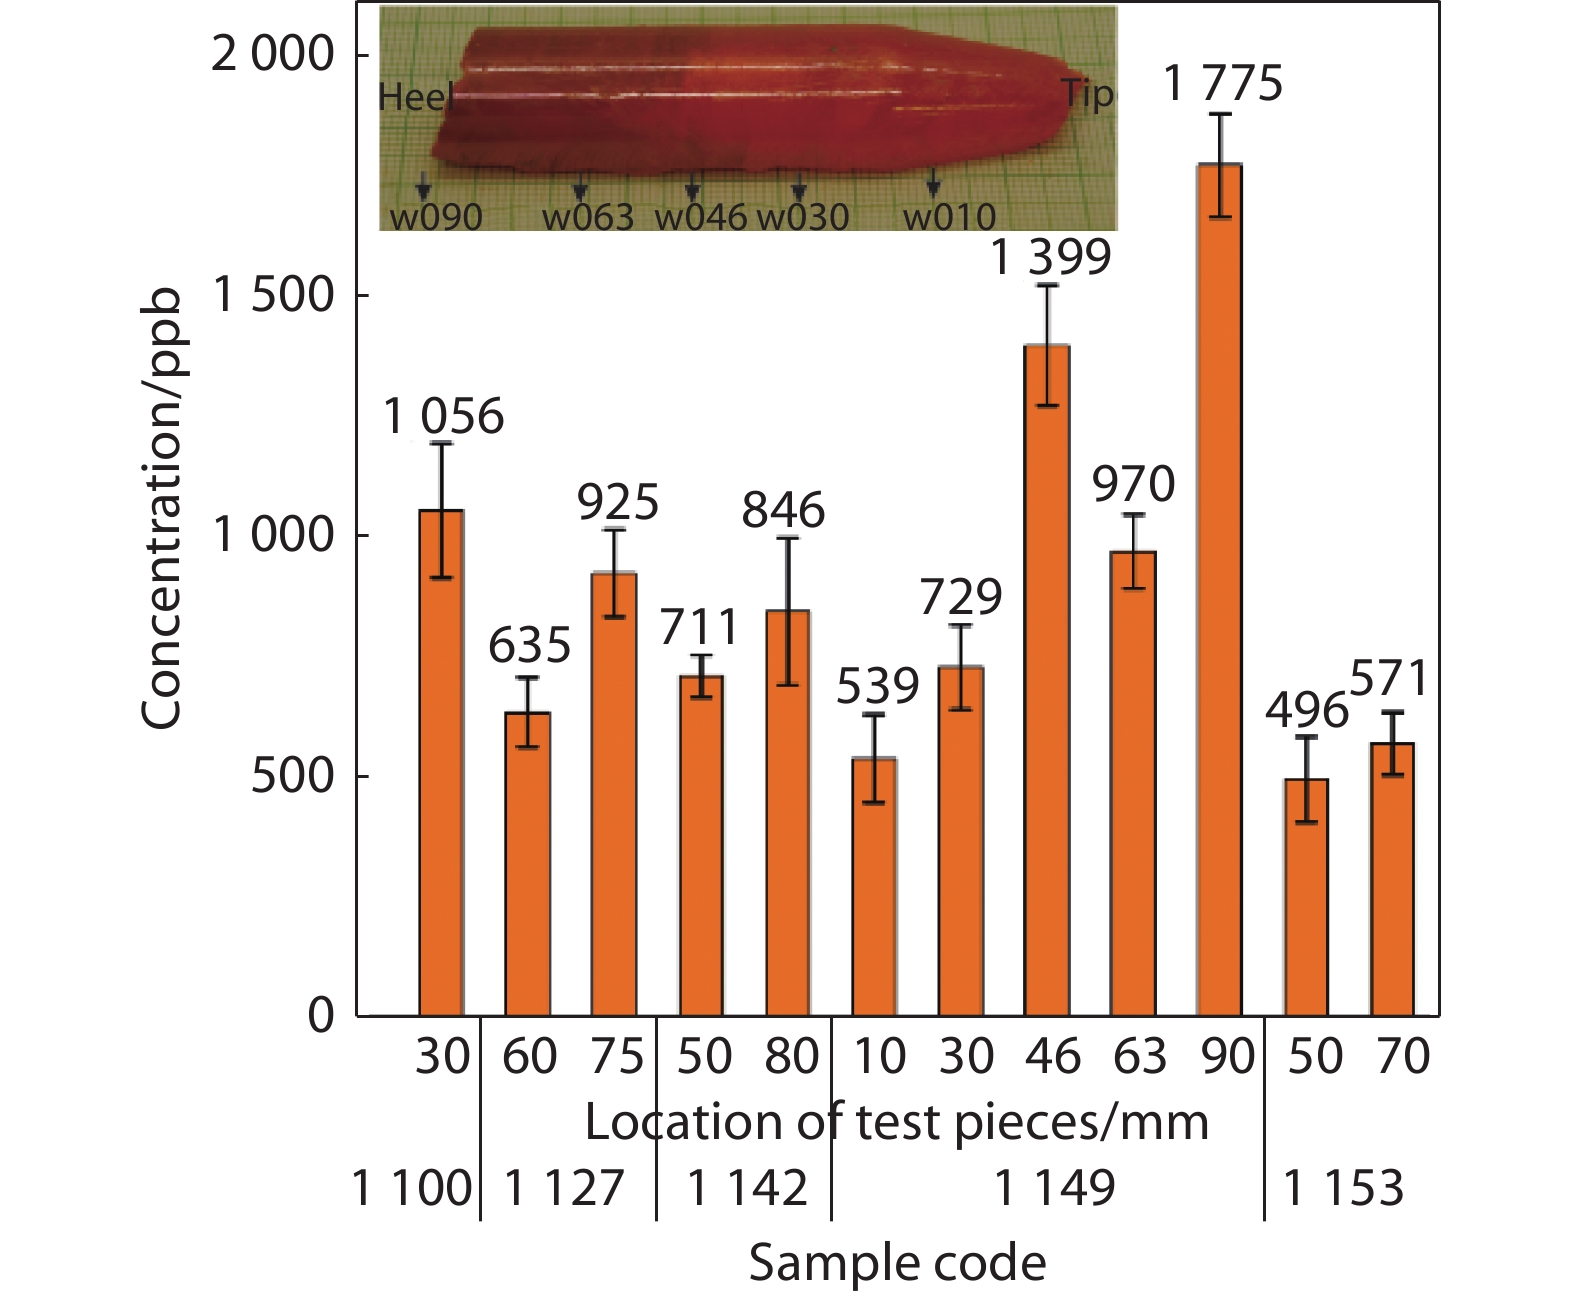
In addition to carbon, other trace impurity elements in the CsPbBr3 samples are also expected to segregate towards the tip or the heel during zone refining. Based on early research in our group, an ICP-MS protocol has been developed to detect trace impurity levels in CsPbBr3 single crystals.[38] Here, ICP-MS was used to analyze up to 66 trace elements in the CsPbBr3 single crystals. Most trace elements exhibited a concentration level that lies below the method quantification limits in all samples. After zone refining, the total impurity concentration of most samples is below 1 ppm, indicating a high purity level of grown single crystals. The two dominating trace impurities are Na and Rh (90% of the total impurity concentration), which might be introduced from the precursor materials. Compared to sample
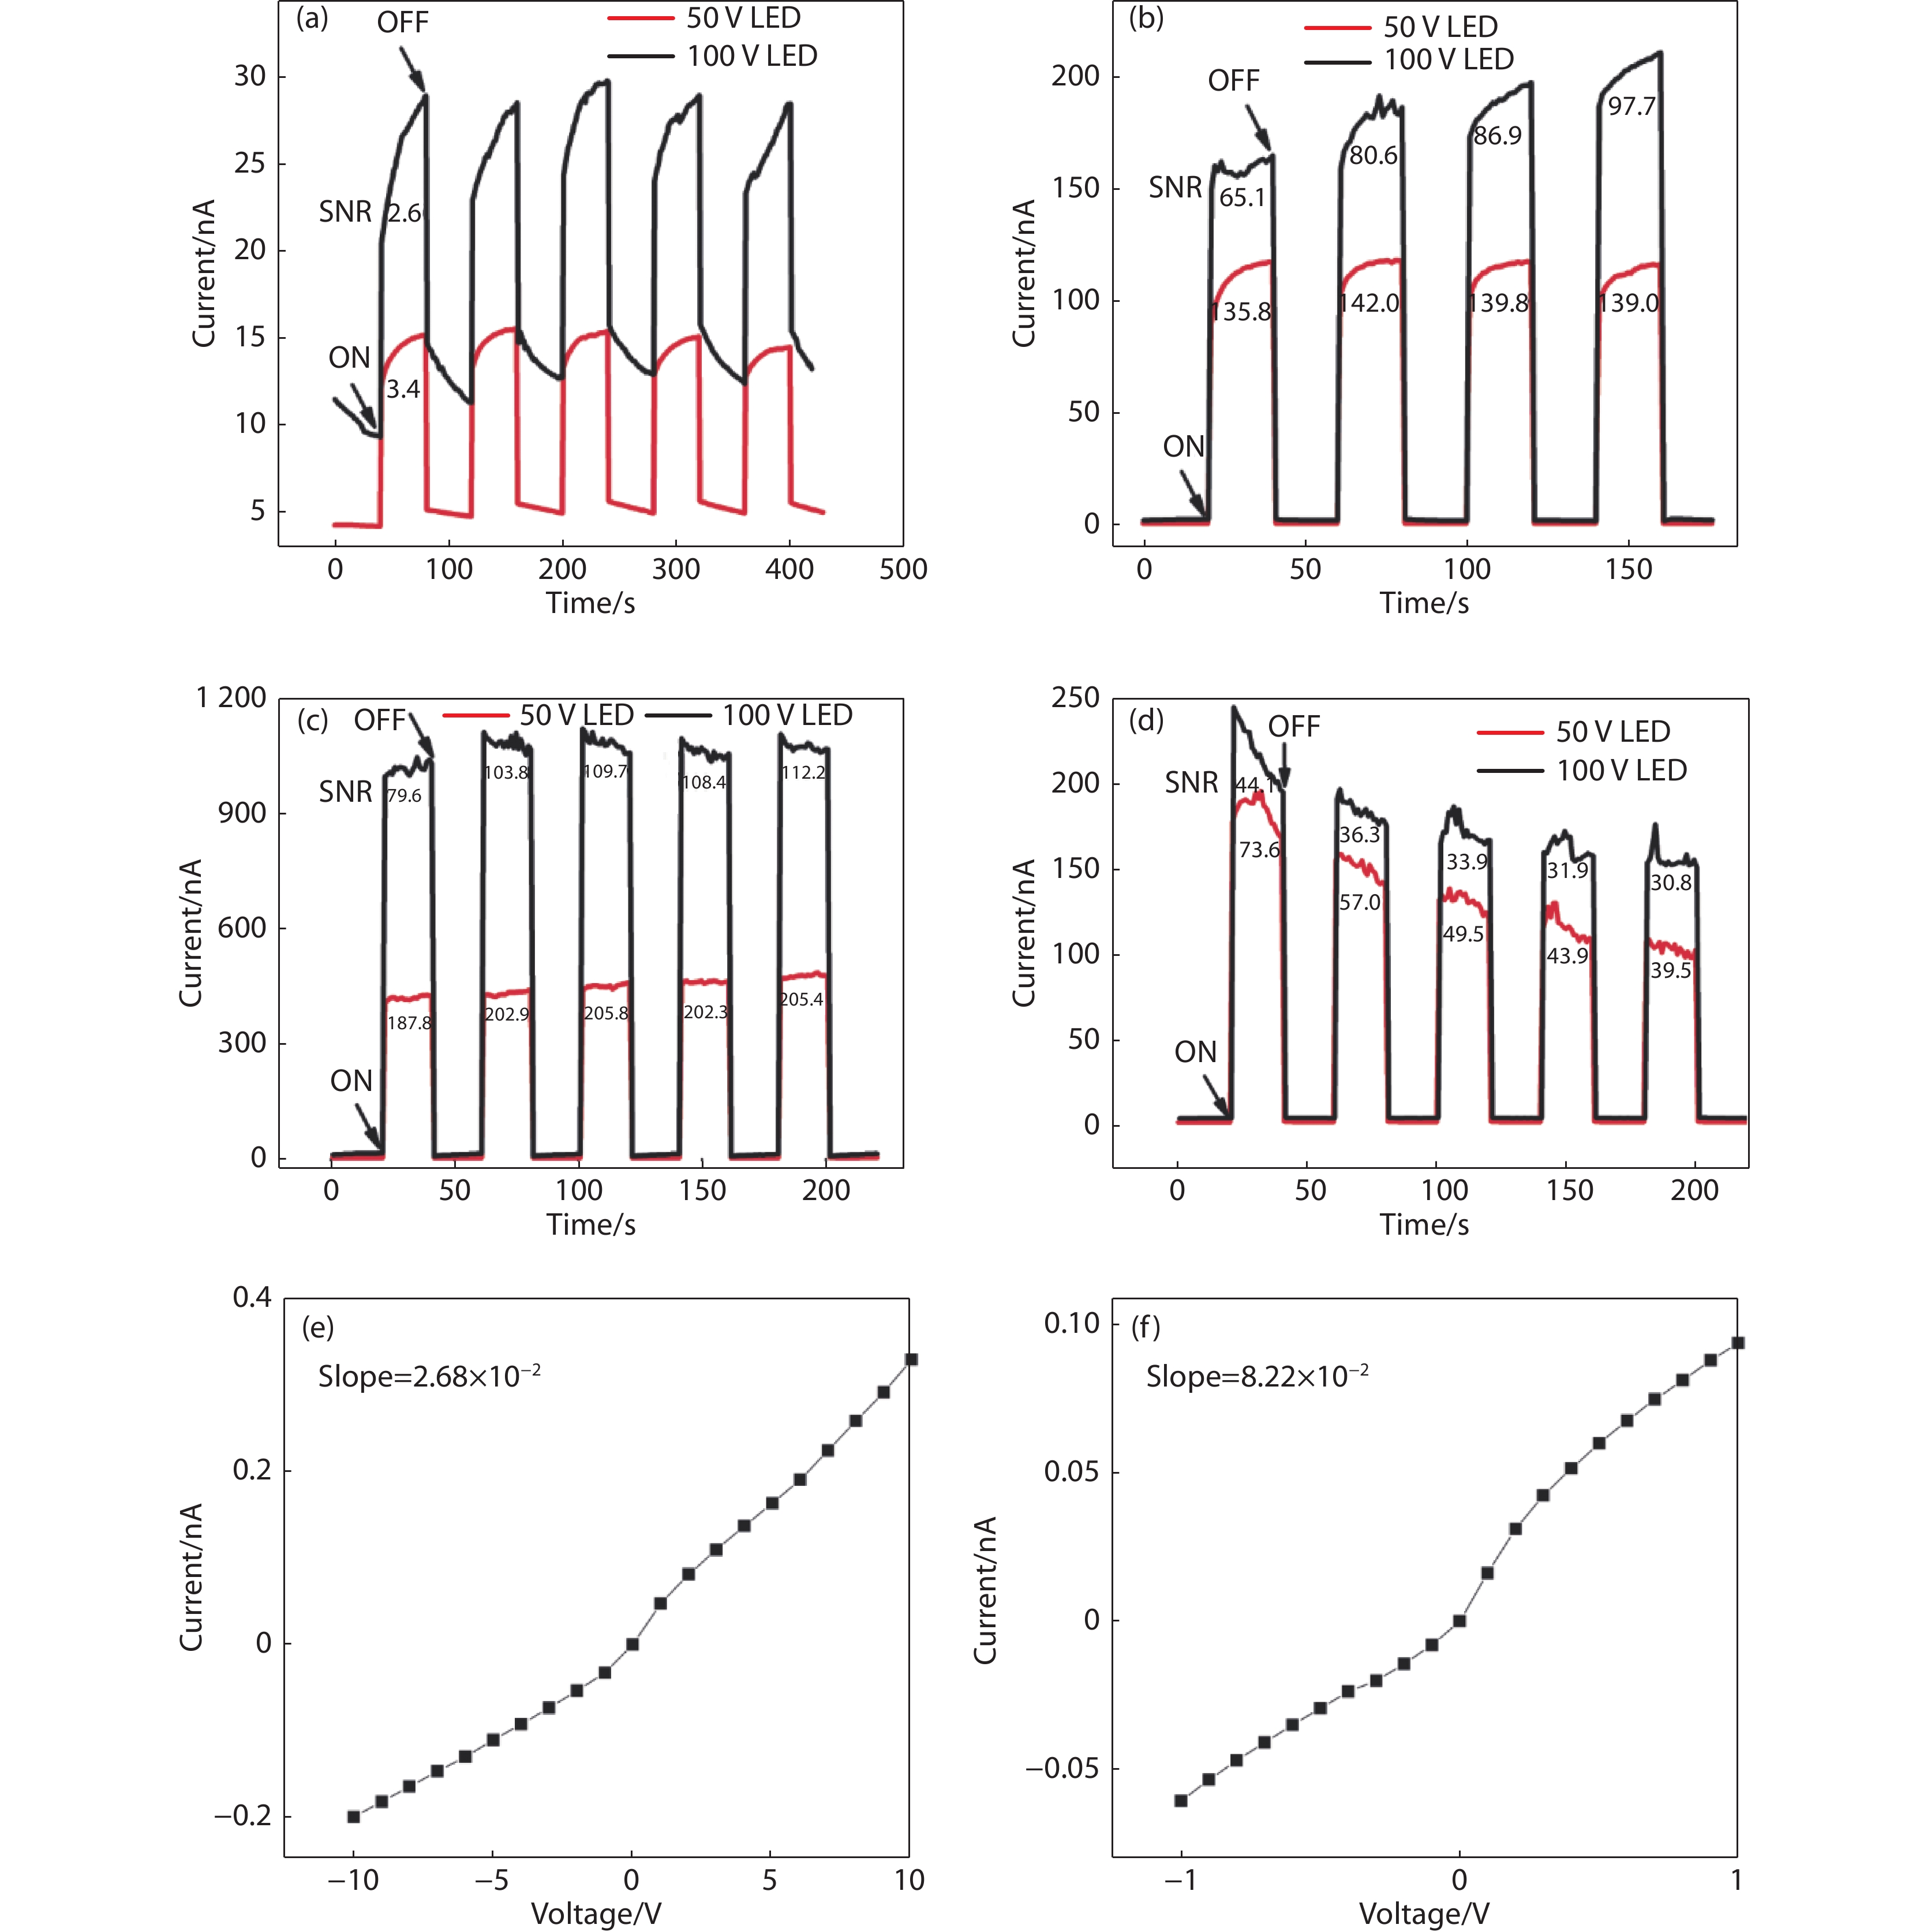
To evaluate the properties of the CsPbBr3 crystals, clear CsPbBr3 wafers were lapped and polished to a maximum surface roughness 0.1µm. The polished wafers showed uniform change of transparency under a transmissive polarized light source, suggesting their single crystalline nature. In addition, X-ray diffraction measurements were performed on several wafers of the same ingot, which exhibited dominating preferred orientation along the (002) crystal plane. The single crystal wafers were fabricated into detector devices, which were then subjected to the current-voltage (I-V) tests and photo-response measurements. These photo-electrical data form a series of comparable feedback to guide the preparative experiments to produce single crystals with the highest signal-to-noise (SNR) ratio under the illumination of a light source.
Heel pieces containing high concentrations of carbon impurity exhibited an extremely low SNR (less than 5) because the carbon impurity could act as trapping centers for charge carriers and reduce the photosensitivity of the material. Similarly, the Bridgman-grown sample (
While all the clear, transparent CsPbBr3 samples produced from the combined zone-refining and crystal growth method exhibited significancy higher photo-electrical response, minor stoichiometry deviations in these zone-refined CsPbBr3 samples can strongly modify their electrical behaviours. We have prepared a series of CsPbBr3 with varying Cs: Pb ratios via the optimized zone-refining method, as well as via the Bridgman method. WDS was used to determine the elemental composition of all the as-grown CsPbBr3 samples. Table 3 shows the Cs/Pb molar ratios of 4 samples. Despite the different growing methods and starting compositions, the molar ratios of Cs: Pb in the grown crystals are all close to 1:1.012 ± 0.007. This result elucidated a natural tendency for the CsPbBr3 crystals to maintain a Cs deficiency. This also indicates that a slight deviation from the stoichiometry of starting materials does not affect the internal Pb/Cs molar ratio in as-grown single crystals. However, samples with different ratios of precursors did display a significantly different photoresponse performance.
Sample | Starting Materials | After Crystal Growth | ||
PbBr2/CsBr | Pb | Cs | ||
1.00: 1.00 | ||||
1.00: 1.00 | ||||
1.02: 1.00 | ||||
1.00: 1.01 |
In comparison to sample
The intrinsic resistivity measurements of different samples in the dark conditions have also been investigated via characteristic current-voltage (I-V) curves. Fig. 8e and 8f show the I-V curves measured for sample
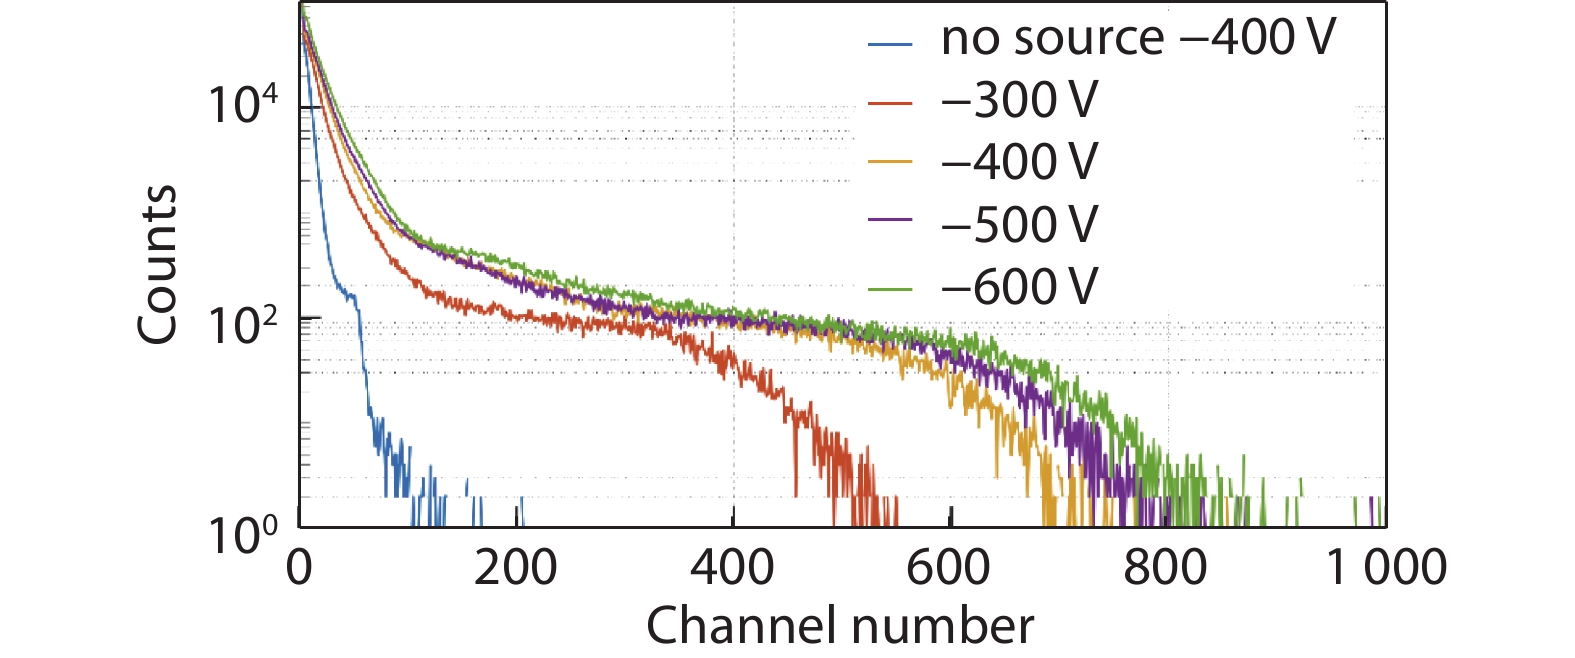
The pulse-height spectra a 0.9μCi 241Am source were collected using a CsPbBr3 detector device produced from sample
High-quality CsPbBr3 single crystals were successfully grown via a modified zone refining process. High purity crystals were obtained with a total impurity level of less than 1 ppm. In the grown single crystals, WDS analyses revealed a slight deviation from the nominal stoichiometry, which is not impacted by the Pb/Cs molar ratio in the starting materials under the zone refining conditions. Photo-electrical measurements of all the samples were carried out. The obtained CsPbBr3 semiconductor detectors reached a high resistivity within a range of 108~109 Ω·cm. Compared to the non-zone refining sample, photo-responses of the zone refined CsPbBr3 detector devices are improved by a factor of tens. Among all the other zone-refined samples, the sample started with a 2% molar ratio of extra PbBr2 during the synthesis exhibited the best photo-response performance, indicating the Pb rich condition prohibits the formation of certain charge carrier trapping defects. The pulse-height spectrum of the CsPbBr3 semiconductor was collected, which exhibited a charge collection response towards the radiation source. Better energy resolution can be achieved by further improvement on the quality of grown crystals and device configurations.
The authors acknowledge the Natural Sciences and Engineering Research Council of Canada (NSERC) and the Canada Foundation for Innovation (CFI) for financial support. The authors also acknowledge the support from Arthur B. McDonald Canadian Astroparticle Physics Research Institute and the government of Ontario.
Appendix A. Total impurity concentrations of different samples.
Appendix B. The concentrations of 66 trace elements detected in the sample
Elements | Concentrations /ppb wt. | Elements | Concentrations /ppb wt. | Elements | Concentrations /ppb wt. |
Li | < MQL | Ge | < MQL | Sm | 0.000 |
Be | < MQL | As | < MQL | Eu | 0.013 |
B | < MQL | Se | 1.9 | Gd | 0.014 |
Na | 465.0 | Rb | < MQL | Tb | < MQL |
Mg | < MQL | Sr | < MQL | Dy | 0.003 |
Al | < MQL | Y | < MQL | Ho | 0.003 |
Si | < MQL | Zr | < MQL | Er | 0.000 |
P | < MQL | Nb | < MQL | Tm | 0.000 |
S | < MQL | Mo | 6.7 | Yb | 0.002 |
K | < MQL | Ru | < MQL | Lu | 0.000 |
Ca | < MQL | Rh | 246.0 | Hf | < MQL |
Sc | < MQL | Pd | < MQL | Ta | < MQL |
Ti | < MQL | Ag | < MQL | W | < MQL |
V | < MQL | Cd | 0.000 | Re | 0.003 |
Cr | < MQL | Sn | < MQL | Os | < MQL |
Mn | < MQL | Sb | < MQL | Ir | < MQL |
Fe | < MQL | Te | < MQL | Pt | < MQL |
Co | < MQL | Ba | 0.539 | Au | < MQL |
Ni | < MQL | La | 0.038 | TI | 0.926 |
Cu | < MQL | Ce | 0.061 | Bi | 8.5 |
Zn | < MQL | Pr | 0.001 | Th | < MQL |
Ga | < MQL | Nd | < MQL | U | < MQL |
Appendix C. A pulse was captured on an oscilloscope connected to the output of the preamplifier.
The authors declare no conflict of interest.
Trace impurity analysis of CsPbBr3 crystals by ICP-MS was conducted by Alexandre Voinot in the Department of Geological Sciences and Geological Engineering at Queen's University.
Elemental analysis of CsPbBr3 crystals by WDS was performed by Brian Joy and Steve Beyer in the Department of Geological Sciences and Geological Engineering at Queen's University.
Matthew Webster, from the Department of Physics, Engineering Physics & Astronomy at Queen’s University, constructed the instrument used for photosensitivity measurements and carried out pulse-height measurement and analysis.
Apart from the above experiments, the research work presented in this manuscript was performed by Yu Wu under the supervision of Prof. Peng Li Wang in the Department of Chemistry at Queen’s University.
1. | T. E. Schlesinger, J. E. Toney, H. Yoon, E. Y. Lee, B. A. Brunett, L. Franks, R. B. James, Materials Science and Engineering: R: Reports, 2001, 32, 103 |
2. | S. D. Sordo, L. Abbene, E. Caroli, A. M. Mancini, A. Zappettini, P. Ubertini, Sensors, 2009, 9, 3491 |
3. | H. H. Barrett, J. D. Eskin, H. B. Barber, Physical Review Letters, 1995, 75, 156 |
4. | P. M. Johns, J. C. Nino, Journal of Applied Physics, 2019, 126, 040902 |
5. | A. Mirzaei, J.-S. Huh, S. S. Kim, H. W. Kim, Electronic Materials Letters, 2018, 14, 261 |
6. | L. Gao, Q. Yan, Solar RRL, 2020, 4, 1900210 |
7. | B. D. Milbrath, A. J. Peurrung, M. Bliss, W. J. Weber, Journal of Materials Research, 2008, 23, 2561 |
8. | K. Hitomi, T. Tada, S. Kim, Y. Wu, T. Tanaka, T. Shoji, H. Yamazaki, K. Ishii, IEEE Trans. Nucl. Sci., 2011, 58, 1987 |
9. | C. Szeles, IEEE Trans. Nucl. Sci., 2004, 51, 1242 |
10. | W. Lin, Z. Liu, C. C. Stoumpos, S. Das, Y. He, I. Hadar, J. A. Peters, K. M. McCall, Y. Xu, D. Y. Chung, B. W. Wessels, M. G. Kanatzidis, Crystal Growth & Design, 2019, 19, 4738 |
11. | U. N. Roy, G. S. Camarda, Y. Cui, R. Gul, A. Hossain, G. Yang, J. Zazvorka, V. Dedic, J. Franc, R. B. James, Scientific Reports, 2019, 9, 1620 |
12. | K. Hitomi, T. Shoji, K. Ishii, Journal of Crystal Growth, 2013, 379, 93 |
13. | G. F. Knoll, Radiation Detection and Measurement, John Wiley & Sons, America, 2010. |
14. | M. Ahmadi, T. Wu, B. Hu, Advanced Materials, 2017, 29, 1605242 |
15. | X. Li, Y. C. Wang, L. Zhu, W. Zhang, H. Q. Wang, J. Fang, ACS Appl. Mater. Interfaces, 2017, 9, 31357 |
16. | Z. Chen, Q. Dong, Y. Liu, C. Bao, Y. Fang, Y. Lin, S. Tang, Q. Wang, X. Xiao, Y. Bai, Y. Deng, J. Huang, Nat. Commun., 2017, 8, 1890 |
17. | B. Han, B. Cai, Q. Shan, J. Song, J. Li, F. Zhang, J. Chen, T. Fang, Q. Ji, X. Xu, H. Zeng, Advanced Functional Materials, 2018, 28, 1804285 |
18. | H. Wei, J. Huang, Nature Communications, 2019, 10, 1066 |
19. | S. Yakunin, D. N. Dirin, Y. Shynkarenko, V. Morad, I. Cherniukh, O. Nazarenko, D. Kreil, T. Nauser, M. V. Kovalenko, Nature Photonics, 2016, 10, 585 |
20. | J. Yu, G. Liu, C. Chen, Y. Li, M. Xu, T. Wang, G. Zhao, L. Zhang, Journal of Materials Chemistry C, 2020, 8, 6326 |
21. | B. Conings, J. Drijkoningen, N. Gauquelin, A. Babayigit, J. D'Haen, L. D'Olieslaeger, A. Ethirajan, J. Verbeeck, J. Manca, E. Mosconi, F. D. Angelis, H.-G. Boyen, Advanced Energy Materials, 2015, 5, 1500477 |
22. | G. P. Nagabhushana, R. Shivaramaiah, A. Navrotsky, Proceedings of the National Academy of Sciences, 2016, 113, 7717 |
23. | C. C. Stoumpos, C. D. Malliakas, J. A. Peters, Z. Liu, M. Sebastian, J. Im, T. C. Chasapis, A. C. Wibowo, D. Y. Chung, A. J. Freeman, B. W. Wessels, M. G. Kanatzidis, Crystal Growth & Design, 2013, 13, 2722 |
24. | Y. He, L. Matei, H. J. Jung, K. M. McCall, M. Chen, C. C. Stoumpos, Z. Liu, J. A. Peters, D. Y. Chung, B. W. Wessels, M. R. Wasielewski, V. P. Dravid, A. Burger, M. G. Kanatzidis, Nature Communications, 2018, 9, 1609 |
25. | J. Kang, L.-W. Wang, The Journal of Physical Chemistry Letters, 2017, 8, 489 |
26. | J. Ding, S. Du, Z. Zuo, Y. Zhao, H. Cui, X. Zhan, The Journal of Physical Chemistry C, 2017, 121, 4917 |
27. | B. Murali, H. K. Kolli, J. Yin, R. Ketavath, O. M. Bakr, O. F. Mohammed, ACS Materials Letters, 2020, 2, 184 |
28. | X. Cheng, S. Yang, B. Cao, X. Tao, Z. Chen, Advanced Functional Materials, 2020, 30, 1905021 |
29. | D. Y. Chung, M. G. Kanatzidis, F. Meng, C. D. Malliakas, SPIE Optics + Photonics, San Diego, CA, USA, August 2016. |
30. | M. Zhang, Z. Zheng, Q. Fu, Z. Chen, J. He, S. Zhang, C. Chen, W. Luo, Journal of Crystal Growth, 2018, 484, 37 |
31. | K. Wang, L. Jing, Q. Yao, J. Zhang, X. Cheng, Y. Yuan, C. Shang, J. Ding, T. Zhou, H. Sun, W. Zhang, H. Li, The Journal of Physical Chemistry Letters, 2021, 12, 1904 |
32. | J.-L. Pouchou, F. Pichoir, Electron Probe Quantitation, Springer, Germany, 1991. |
33. | K. F. J. Heinrich, 11th Int. Congr. on X-Ray Optics and Microanalysis, London, Ontario, Canada, August 1986. |
34. | K. L. Williams, An introduction to X-ray spectrometry: X-ray fluorescence and electron microprobe analysis, Allen & Unwin Boston, America, 1987. |
35. | H. Zhang, F. Wang, Y. Lu, Q. Sun, Y. Xu, B.-B. Zhang, W. Jie, M. G. Kanatzidis, Journal of Materials Chemistry C, 2020, 8, 1248 |
36. | H. Kim, Y. Ogorodnik, A. Kargar, L. Cirignano, C. L. Thrall, W. Koehler, S. P. O'Neal, Z. He, E. Swanberg, S. A. Payne, M. R. Squillante, K. Shah, Frontiers in Physics, 2020, 8, 55 |
37. | A. Churilov, W. Higgins, G. Ciampi, H. Kim, L. Cirignano, F. Olschner, K. Shah, SPIE Optics+Photonics 2008, San Diego, CA, USA, August 2008. |
38. | U. Makanda, A. Voinot, R. Kandel, Y. Wu, M. Leybourne, P. Wang, Journal of Analytical Atomic Spectrometry, 2020, 35, 2672 |
This is an open access article under the terms of the Creative Commons Attribution License, which permits use, distribution and reproduction in any medium, provided the original work is properly cited.
Sample | Zone refining | Pb/Cs molar ratio | Traverse speed |
No | 1.00: 1.00 | N/A | |
Yes | 1.00: 1.00 | 20 mm/h X 1, 5 mm/h X 4 | |
Yes | 1.02: 1.00 | 10 mm/h X 10, 5 mm/h X 1 | |
Yes | 1.00: 1.01 | 10 mm/h X2, 5 mm/h X3 |
Sample | Elemental mole fraction | ||
Cs | Pb | Br | |
Phase 1 | 0.01 ± 0.02 | 1.00 ± 0.02 | 1.953 ± 0.009 |
Phase 2 | 1.000 ± 0.004 | 2.04 ± 0.01 | 5.11 ± 0.01 |
(*: It is worth noting that the WDS test for CsPbBr3 samples displayed slightly low analytical totals due to systematic errors in the matrix corrections.) |
Sample | Starting Materials | After Crystal Growth | ||
PbBr2/CsBr | Pb | Cs | ||
1.00: 1.00 | ||||
1.00: 1.00 | ||||
1.02: 1.00 | ||||
1.00: 1.01 |
Elements | Concentrations /ppb wt. | Elements | Concentrations /ppb wt. | Elements | Concentrations /ppb wt. |
Li | < MQL | Ge | < MQL | Sm | 0.000 |
Be | < MQL | As | < MQL | Eu | 0.013 |
B | < MQL | Se | 1.9 | Gd | 0.014 |
Na | 465.0 | Rb | < MQL | Tb | < MQL |
Mg | < MQL | Sr | < MQL | Dy | 0.003 |
Al | < MQL | Y | < MQL | Ho | 0.003 |
Si | < MQL | Zr | < MQL | Er | 0.000 |
P | < MQL | Nb | < MQL | Tm | 0.000 |
S | < MQL | Mo | 6.7 | Yb | 0.002 |
K | < MQL | Ru | < MQL | Lu | 0.000 |
Ca | < MQL | Rh | 246.0 | Hf | < MQL |
Sc | < MQL | Pd | < MQL | Ta | < MQL |
Ti | < MQL | Ag | < MQL | W | < MQL |
V | < MQL | Cd | 0.000 | Re | 0.003 |
Cr | < MQL | Sn | < MQL | Os | < MQL |
Mn | < MQL | Sb | < MQL | Ir | < MQL |
Fe | < MQL | Te | < MQL | Pt | < MQL |
Co | < MQL | Ba | 0.539 | Au | < MQL |
Ni | < MQL | La | 0.038 | TI | 0.926 |
Cu | < MQL | Ce | 0.061 | Bi | 8.5 |
Zn | < MQL | Pr | 0.001 | Th | < MQL |
Ga | < MQL | Nd | < MQL | U | < MQL |
System design for (a) H2 reduction and (b) Horizontal zone refining furnace.
Temperature profile for a typical zone-refining cycle, where the red region marks the temperature above the melting point (567
Main components of a fabricated CsPbBr3 test device.
Comparison of zone refining performances between two sealing techniques (a) sealing under a high vacuum, (b) sealing with 0.3 atm of H2 gas.
(a) and (b) CsPbBr3 bulk after zone refining. (c) As-cut crystal wafers. (d) The polished detector.
Raman spectra of black impurity. Insert shows the isolation of the black impurity from CsPbBr3 by sublimation.
Total impurity levels of samples
Photoresponse results of CsPbBr3 detectors from different samples with Ag/Ag contact. (a) sample 1100. (b) sample 1127. (c) sample 1149. (d) sample 1153. Current-voltage (I-V) curves of (e) sample
Pulse-height spectrum collected for the CsPbBr3 crystal device with a Ga\CsPbBr3\Ga configuration.