Processing math: 100%

Wang-Qi Bao, Xing Yang, Tian-En Shi, Ze Li, Yi-Xin Zhang, Jing Feng, Zhen-Hua Ge. The role of Ag8GeS6 addition in p-type SnSe with enhanced thermoelectric properties[J]. Materials Lab, 2024, 3(3): 240011. doi: 10.54227/mlab.20240011
Citation: Wang-Qi Bao, Xing Yang, Tian-En Shi, Ze Li, Yi-Xin Zhang, Jing Feng, Zhen-Hua Ge. The role of Ag8GeS6 addition in p-type SnSe with enhanced thermoelectric properties[J]. Materials Lab, 2024, 3(3): 240011. doi: 10.54227/mlab.20240011

RESEARCH ARTICLE

The role of Ag8GeS6 addition in p-type SnSe with enhanced thermoelectric properties

More Information
  • Corresponding author: zge@kust.edu.cn
  • Polycrystalline SnSe is anticipated to perform in thermoelectric applications within the intermediate temperature range due to its superior machinability and more accessible synthesis conditions relative to single-crystal SnSe. Nonetheless, the subpar electrical properties of SnSe present a significant challenge in strengthening its electrical transport performance while preserving its intrinsic low heat conductivity, hence impeding the advancement of polycrystalline SnSe performance. This work examined the alterations in thermoelectric characteristics following the introduction of Ag8GeS6 compound into SnSe. When the Ag8GeS6 enters the SnSe matrix, the carrier concentration increases due to the Ag+ substitution, and the n-type second phase Ag2Se in the SnSe matrix acts as an electron attraction center also play an important role. Therefore, the electrical transport property increases from 306 μW m−1 K−2 of the pristine sample to 617 μW m−1 K−2 of the SnSe doped with 0.25 weight percent Ag8GeS6 sample at 873 K. Besides, the thermal conductivity is kept by the point defects, second phase, and dislocations, which can enhance the phonon scattering, and a low lattice thermal conductivity of 0.3 W m−1 K−1 for the SnSe doped with 0.125 weight percent Ag8GeS6 sample is obtained at 873 K. Consequently, a peak ZT value of 1.3 at 873 K and a high average ZT value of 0.57 from 323-873 K were achieved for SnSe doped with 0.25 weight percent Ag8GeS6. This demonstrates the potential in the field of power generation.


  • The increasingly severe environmental pollution and the global energy landscape have imposed higher requirements on the development of sustainable energy technologies.[1,2] Thermoelectric materials can realize the direct conversion of heat and electricity and have great potential for application in solving the energy crisis and environmental pollution problems.[36] The property of thermoelectric materials is evaluated via the thermoelectric material’s dimensionless figure of merit ZT = S2σT/κ, where S, σ, κ, and T are the Seekeck coefficient, electrical conductivity, thermal conductivity, and absolute temperature, respectively.[79] The challenge of optimizing thermoelectric performance resides in the intense coupling between electrical properties and thermal properties. In the past decades, researchers have proposed many optimization strategies that increasing electrical conductivity and reducing thermal conductivity, such as optimizing carrier concentration, band alignment, regulating the scattering mechanism of carriers, entropy engineering, the structural manipulations, dislocation engineering and nanostructuring.[1015] Since the range of most industrial waste heat lies within the medium-temperature region, numerous promising thermoelectric materials for the medium-temperature region have been investigated and reported. For instance, Cu2S3, Bi2S3, Cu2Se, PbTe, PbSe, SnSe exhibit potentially promising performance.[1619]

    SnSe has received extensive attention from thermoelectric researchers due to its intrinsic advantage of low thermal conductivity. Polycrystalline SnSe has more practical application prospects than single-crystal SnSe because it has better mechanical properties and easier preparation process.[20,21] However, The performance optimization of polycrystalline SnSe presents a challenge when compared to single-crystal SnSe, primarily due to its inferior electrical transport properties. Consequently, the crucial aspect of enhancing the performance of SnSe is focused on improving its electrical transport characteristics. In p-type SnSe, the introduction of alkali metals, Ag, Cu, and S elements has been proven to be an effective strategy for improving electrical transport performance. Li et al.[22] reported that doping Ag in SnSe matrix increased the hole carrier concentration to 8 × 1018 cm−3. Eventually, the Ag0.015Sn0.985Se sample achieved a ZT value of 1.3 at 773 K. However, while the electrical performance of SnSe was improved by Ag doping, the thermal performance also increases significantly, which hinders further performance improvement. Maintaining low thermal conductivity while optimizing the electrical performance of SnSe is a major obstacle in improving the thermoelectric performance of SnSe. Han et al.[23] proposed introducing S elements in SnSe matrices to optimize the thermal transport properties. The findings indicate that thermal conductivity is reduced while maintaining the electrical transport properties. As a result, the thermoelectric performance of the S alloying SnSe sample is optimized. On the basis of doping with S, the further introduction of Ge has been proved to enhance the thermoelectric performance. The Ge elements are further introduced to achieve a high Seebeck coefficient by band alignment. The findings indicate that with the co-doping method of S and Ge elements, the sample achieves a largely enhanced power factor of 5.84 mW cm−1 K−2 at 873 K. Due to phonon scattering from the nanorods within the matrix and mass fluctuations induced by the doping components, an exceptionally low thermal conductivity of 0.15 W m−1 K−1 is attained at 873 K.[24]

    In this work, we introduced Ag8GeS6 into SnSe to enhance its thermoelectric performance. The compound decomposes in the matrix, and each element is expected to play its respective optimizing role. The results of electrical property measurement indicate that the electrical properties have been significantly improved after the introduction of the dopant. Firstly, Ag doping increases the carrier concentration of the matrix through the introduction of additional holes, which is in line with the expected results. Meanwhile, foreign Ag ions interact with the matrix to produce the Ag2Se secondary phase, contributing to the optimization of both electrical and thermal performances. In p-type SnSe, the precipitates of n-type Ag2Se serve as electron-attracting centers, thus increasing the concentration of hole carriers. A similar effect has been reported in the work on adding n-type SnSe2 to p-type SnSe.[25] Ag2Se presents a special twinned structure in the matrix, which can optimize the thermal conductivity with minimal scattering of carriers. Combined with the increase in the Seebeck coefficient brought about by Ge ions, the electrical transport property increases from 306 μW m−1 K−2 of the pristine sample to 617 μW m−1 K−2 of the SnSe doped with 0.25 weight percent Ag8GeS6 sample. Point defects introduced by doping and the formation of the second phase can strengthen phonon scattering, thereby optimizing the thermal conductivity. The introduction of S also gives rise to mass fluctuations. At 873 K, the thermal conductivity of the SnSe doped with 1.0 weight percent Ag8GeS6 sample reaches 0.38 W m−1 K−1, a level comparable to that of the pure sample. Due to the optimization of electrical properties and the maintenance of thermal conductivity, both the peak ZT and the average ZT are optimized after adding Ag8GeS6 to SnSe.

    All samples were synthesized by mixing high-purity Sn, Se, and Ag8GeS6 that followed previous reports.[26] They were weighted according to the stoichiometric ratio and placed into a quartz tube with a diameter of 15 mm. To prevent the raw materials from being oxidized, the quartz tube was vacuumed and sealed by flame after being purged with argon gas. The well-sealed quartz tube was encapsulated in another quartz tube with a diameter of 26 mm to prevent it from rupturing due to the volume expansion resulting from phase change. Subsequently, the sample was heated from 25 °C to 950 °C for a duration of 10 hours and maintained this temperature for 24 hours. Then, allow it to cool to room temperature for a duration of 10 hours. The ingot obtained was ground into powder using a mortar. The powder was molded into circular blocks with a diameter of 15 mm at 50 MPa and 773 K for 5 min by spark plasma sintering.

    The phase compositions of all samples were ascertained by measuring the X-ray diffraction within the range of 20 to 70 degrees utilizing a MiniFlex600 with Cu Kα radiation. The microstructural and micro-characteristic aspects of the sample were characterized by employing field emission scanning electron microscopy (FESEM; Sigma 300; Germany) and scanning transmission electron microscopy (STEM; JEM-F200; Japan). The elemental distributions of the sample were analyzed by using the electron probe X-ray microanalysis (EPMA; Shimadzu; Japan). The prepared bulk samples were sliced into rectangular strips using a wire-cutting device, after which their electrical transport qualities were assessed by CTA (China). The thermal transport characteristics of the samples were evaluated using LFA-457 (Netzsch). Initially, the prepared bulk samples were resized using a wire-cutting apparatus. The thermal diffusivity of the samples was subsequently measured using the LFA-457 (Netzsch). The overall thermal conductivity is determined using the subsequent formula: κtot = DρCp, where D represents the measured thermal diffusivity, ρ is the density obtained via the Archimedes drainage method, and Cp is the specific heat. The carrier concentration and mobility were evaluated using a Hall tester (PPMS9T, Quantum Design Inc., USA). Owing to the presence of measurement errors in the experiment, the uncertainty of electrical conductivity is 3%, the uncertainty of Seebeck coefficient is 2%, and the uncertainty of thermal diffusivity is 5%. Accordingly, the uncertainty of the calculated total thermal conductivity is less than 8%. The uncertainty of the ultimately calculated ZT value is less than 15%.

    The phase composition of the synthesized samples was verified via X-ray diffraction analysis. Fig. 1a displays the XRD patterns of SnSe integrated with different weight percentages of Ag8GeS6. All diffraction peaks for each sample aligned with the standard card (PDF#48-1224), and no peaks indicative of impurity phases were seen. This signifies that the expected samples were generated successfully. Fig. 1b demonstrates that with an increase in Ag8GeS6 concentration, the diffraction peaks of sample shifted to higher angles and subsequently towards lower angles. The result is consistent with the cell volume of each sample in Fig. 1c. With the increase in doping content, the cell volume first decreases and then increases. When the doping content exceeds 0.5, the cell volume changes little, indicating that the dopant has reached the solid solubility limit. Considering the difference in ionic radius of doping elements and SnSe matrix: Ag+ (0.115 nm), Ge4+ (0.053 nm), Sn2+ (0.118 nm), S2- (0.184 nm) and Se2- (0.198 nm), the results can be elucidated by the competition between the lattice contraction from the substitution of Sn2+ sites by Ag+ ions and lattice expansion caused by Ge4+ ions entering the lattice interstitial sites. The XRD patterns initially displayed a shift to higher angles, which implies that the substitution of Sn2+ by Ag+ is dominant and results in lattice contraction. However, as the Ag8GeS6 content reached 0.25 weight percent, the XRD patterns altered to lower angles due to lattice expansion produced by Ge4+ occupying interstitial locations. With the continued increase in Ag8GeS6 content, the XRD patterns remained unchanged, indicating that the solution limit had been attained. The potential reaction involving point defects is outlined as follows:

    Fig. 1  a XRD patterns of the SnSe + x wt% Ag8GeS6 (x = 0, 0.125, 0.25, 0.5, and 1.0) samples; b enlarged XRD patterns in a 2-Theta range of 30°–32°; c the lattice parameters of the SnSe + x wt% Ag8GeS6 (x = 0, 0.125, 0.25, 0.5, and 1.0) samples.
    Ag8GeS6SnSe(8-a)AgSn+(1-b)GeSn+bGei+6SSe+0.5aAg2Se+(6-a-2b)h

    Fig. 2 illustrates the SEM images of the recently broken surfaces across all samples, which were measured to investigate the microstructural impact of Ag8GeS6 doping in SnSe matrix. The typical layered structure was observed in all samples, which is beneficial to enhancing the phonon scattering. Upon the introduction of Ag8GeS6 into the SnSe matrix, the grain size initially expands, followed by a subsequent reduction. When the Ag8GeS6 concentration is low, the growth of grains is continuous owing to the atomic diffusion. Nevertheless, as the Ag8GeS6 content rises, the grain sizes diminish due to the emergence of a second phase that inhibits atomic diffusion. Fig. 2f depicts the experimental density, obtained using the Archimedes drainage method, with the relative density of the bulk samples. The density of all samples is lower than the theoretical density of 6.18 g/cm3 due to the existence of voids and defects. The density of the samples initially rises with an increase in Ag8GeS6 content, followed by a decline, which can be linked to the effects of grain size. The atoms diffusion promotes the growth of grains, so the experimental density increases; however, when the Ag8GeS6 content increases, the second phase emerges, which might impede grain growth, leading to the formation of voids in the SnSe matrix, so the experimental density decreases.

    Fig. 2  FESEM images of the fractured surfaces a x = 0, b x = 0.125, c x = 0.25, d x = 0.5, e x = 1.0, and f the experimental density and relative density for the pristine SnSe +x wt% Ag8GeSe6 (x = 0, 0.125, 0.25, 0.5, and 1.0) bulk samples.

    Fig. 3 shows the electron probe X-ray microanalysis (EPMA) analysis for the polished SnSe doped with 0.25 weight percent Ag8GeS6 sample. The Ge and S elements were predominantly uniformly distributed; nevertheless, Ag-rich patches were identified, while Sn elements were lacking at the corresponding locations in the matrix. This demonstrates that following the decomposition of Ag8GeS6, the Ag reacts with the Se to generate the Ag2Se.

    Fig. 3  EMPA-mapping information for the SnSe + 0.25 wt% Ag8GeS6 sample a BSE image and bf the elements of Sn, Se, Ag, Ge and S, respectively.

    To further investigate the microstructure of Ag8GeS6 doped sample, the results of the field emission transmission electron microscopy (FETEM) are presented in Fig. 4. Fig. 4a shows the low-resolution image of the transmission electron microscope, and the second phase Ag2Se in the matrix is observed and marked with a red box. The corresponding energy-dispersive X-ray spectroscopy (EDS) mapping results are presented in Fig. 4d-h, where the enrichment of Ag elements and the deficiency of Sn elements in the matrix are observed, and both Ge and S elements exhibit a uniform distribution within the matrix. Fig. 4b1 is a high-resolution image of the second phase. It is observable that the second phase exhibits a twin structure and can be clearly perceived in Fig. 4b3. Fig. 4b2 marks the two sets of electron diffraction pattern of the twin structure. The twin structure can enhance the thermoelectric properties because the twin structure can lead to significant phonon scattering, while exerting minimal influence on the scattering of electron carriers, attributed to the distinct transport behaviors and frequencies of phonons and electrons.[27,28] Fig. 4c1 presents a high-resolution image of the dislocations around the second phase marked with white arrows in Fig. 4a, and a IFFT image of red region of c1 is performed in Fig. 4c2. The existence of dislocations may lead to a decrease in thermal conductivity through the promotion of phonon scattering. Through the geometrical phase analysis, as Fig. 4c3 reveals, concentrated stress emerges in the matrix because of the presence of dislocations, which will also serve as a scattering source for phonons and effectively reduce the lattice thermal conductivity.[19,29,30]

    Fig. 4  TEM information for the SnSe + 0.25 wt% Ag8GeS6 sample: a Low-resolution image, b1, b3 high-resolution image, b2 FFT image of b1, c1 high-resolution image, c2 IFFT image of c1, c3 GPA analysis of c1, the EDS-mapping of d Sn, e Se, f Ag, g Ge and h S, respectively.

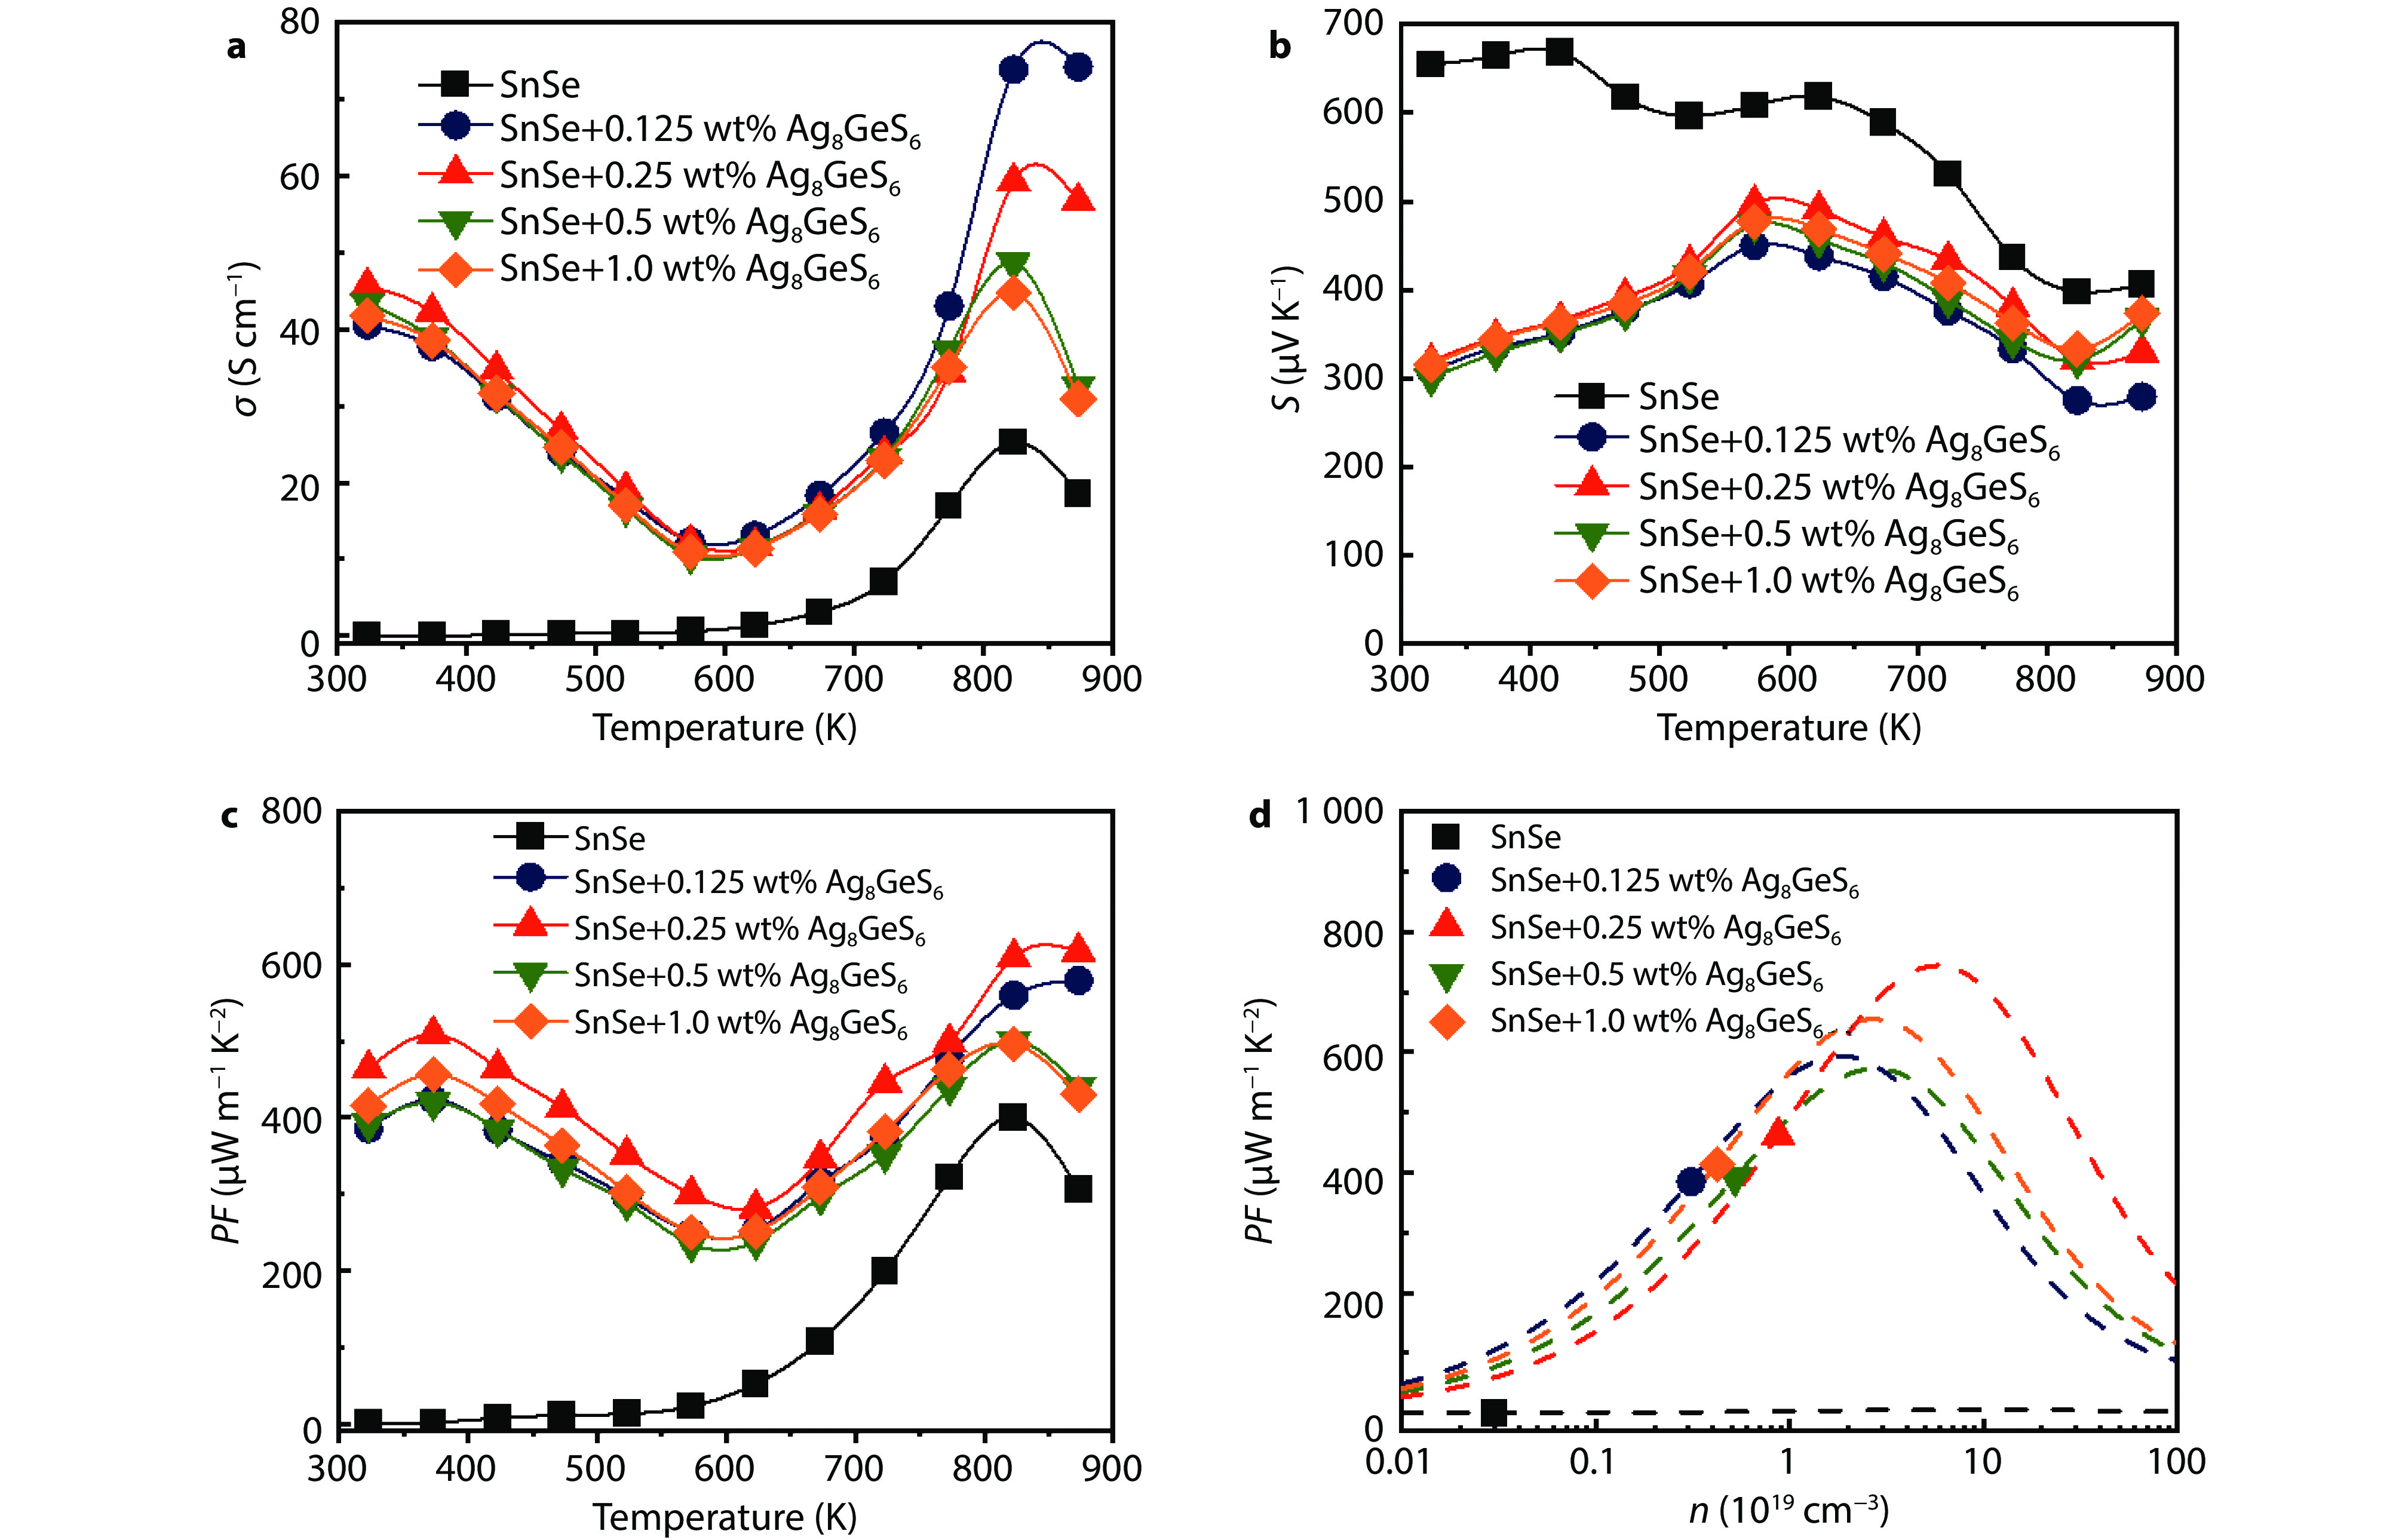
    The electrical conductivities of all bulk SnSe integrated with different weight percentages of Ag8GeS6 in relation to temperature are displayed in Fig. 5a. The electrical conductivity of the doped sample initially decreases as the temperature rises, exhibiting the typical conductivity of heavily doped semiconductors. The reduction in electrical conductivity can be linked to lattice vibration scattering, which is in accordance with previous reports.[31,32] Consequently, due to thermal excitation, the electrical conductivity increases with rising temperature. When the temperature exceeds 800 K, due to the occurrence of phase transition, the conductivity decreases as the temperature rises. The electrical conductivity of the pristine sample increases with the increase of temperature, which shows an intrinsic semiconductor; as the temperature approaches 823 K, there is a notable decrease in electrical conductivity attributed to the phase transition occurring around 800 K. The introduction of Ag8GeS6 results in a significant increase in electrical conductivity, reaching 45 S cm−1 at 323 K for the x = 0.25 sample, which is enhanced in four orders magnitude, compared with that of the pristine sample. The rise in electrical conductivity is linked to a higher carrier concentration in the sample due to the introduction of the dopant. The difference in electronegativity between Ge (2.01) and S (2.58) is smaller than that between Sn (1.96) and Se (2.55), leading to a lower impurity acceptor energy level in relation to the conduction band. As a result, the band gap decreases while the carrier concentration increases.[24] The second phase Ag2Sn is capable of acting as an electron-attracting center, thereby increasing the concentration of hole carriers.[25] With an increase in doping content, the electrical conductivity of the sample initially increases before subsequently decreasing. The fundamental explanation is as follows: at low doping levels, the primary factor is that Ag+ replacing Sn2+ generates hole carriers, thereby improving electrical conductivity. Subsequently, with the doping content on the rise, Ge4+ entering the lattice interstices releases electrons, resulting in the commencement of the decline in electrical conductivity. At 823 K, the electrical conductivity of the sample doped with 0.125 weight percent Ag8GeS6 reaches 74 S cm−1, which is more than three times higher than that of the pure sample.

    Fig. 5  Temperature dependence of electrical transport properties for the SnSe + x wt% Ag8GeS6 (x = 0, 0.125. 0.25, 0.5, and 1.0) samples in the parallel direction along the pressure direction: a Electrical conductivity, b Seebeck coefficient, c power factor, and d the relationship between carrier concentration (n) and power factor at room temperature based on SPB model

    The Seebeck coefficient's temperature dependency for SnSe integrated with varying weight percentages of Ag8GeS6 samples is displayed in Fig. 5b. A positive Seebeck value indicates that all of the samples are p-type semiconductors. At 323 K, the undoped SnSe has a Seebeck coefficient of roughly 651 μV K−1. Because of the increase in carrier concentration, the addition of Ag8GeS6 causes a drop in the Seebeck coefficient in all samples. This result that corresponds to the Mott’s law (S=π2κ2B3q[1nn(E)E+1μμ(E)E]E=Ef),[33] where the Seebeck coefficient shows a negative correlation with the concentration of carriers. With the increase in doping content, more Ge4+ substituting for Sn2+ is conducive to the improvement of the Seebeck coefficient because Ge doping induces band alignment in SnSe.[24] At 573 K, the sample doped with 0.25 weight percent Ag8GeS6 exhibits an increase in Seebeck coefficient to 497 μV K−1. As a result of the increased electrical conductivity, the Ag8GeS6-doped samples' power factor is greatly increased. In particular, at 873 K, the power factor value of the SnSe doped with 0.25 weight percent Ag8GeS6 sample rises to 617 μW m−1 K−2. As shown in Fig. 5d, the single parabolic band model is investigated to elucidate the relationship between carrier concentration and power factor.[34] The findings indicate that an elevated carrier concentration enhances the power factor, hence promoting superior thermoelectric performance.

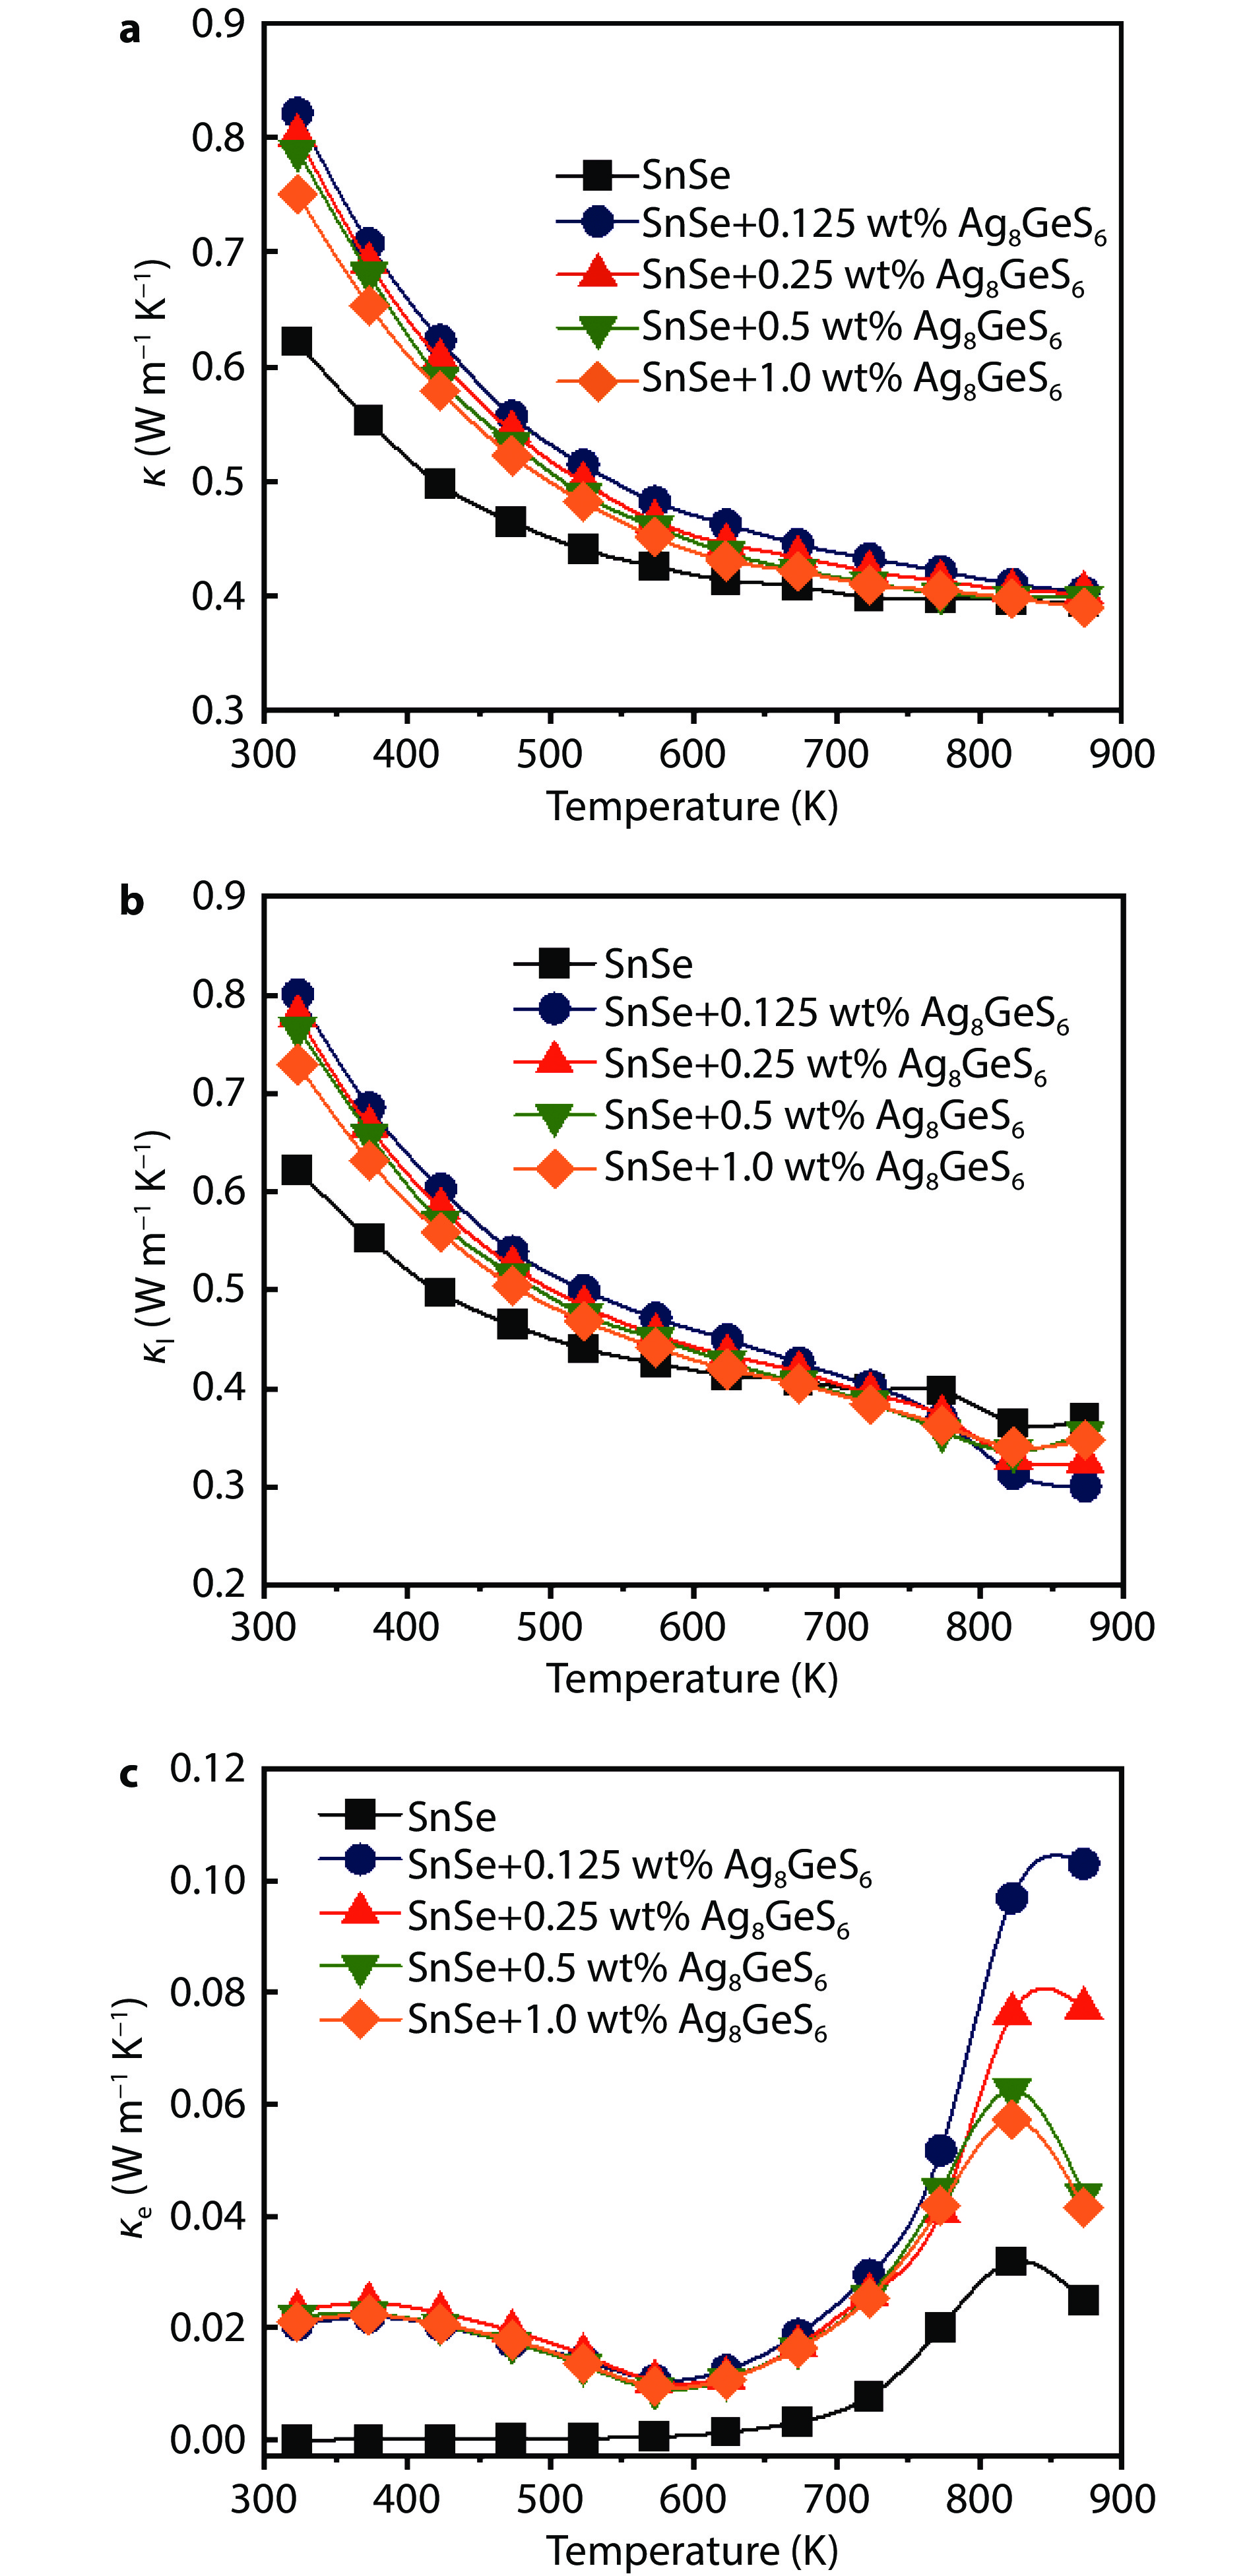
    Fig. 6 illustrates how thermal conductivity varies with temperature for SnSe combined with various weight percentages of Ag8GeS6 samples. The thermal conductivity exhibits a decline as the temperature rises across all samples. Considering the relatively low electron thermal conductivity, attention is directed towards the significance of lattice thermal conductivity in the heat-transfer process. The lattice thermal conductivity of the doped samples is notably higher than that of the undoped samples at low temperatures, due to the incorporation of Ag8GeS6, which promotes grain development. The grown grains will reduce the grain boundary density, thereby weaken phonon scattering. With an increase in doping level, the lattice thermal conductivity of the sample first experiences an increase, followed by a decrease, indicating variations in grain size. As the temperature rises, the introduction of Ag8GeS6 can lead to an increase in the formation of point defects, second phases, and dislocations within the SnSe matrix, which may enhance the scattering of heat-conducting phonons. In the meantime, the introduction of Ge and S can lead to mass fluctuations, thereby reducing the lattice thermal conductivity. The lattice thermal conductivity of the SnSe doped with 0.125 weight percent Ag8GeS6 sample ultimately measures 0.3 W m−1 K−1, which is lower than the 0.36 W m−1 K−1 observed in the pristine sample at 873 K. The overall thermal conductivity κ of the sample doped with 1.0 weight percent Ag8GeS6 reaches 0.38 W m−1 K−1 at 873 K, which is similar to that of the pristine sample.

    Fig. 6  Temperature dependence of thermal transport properties for the SnSe + x wt% Ag8GeS6 (x = 0, 0.125, 0.25, 0.5, and 1.0) samples in the parallel direction along the pressure direction: a Total thermal conductivity (κ), b lattice thermal conductivity (κl), and c electron thermal conductivity (κe).

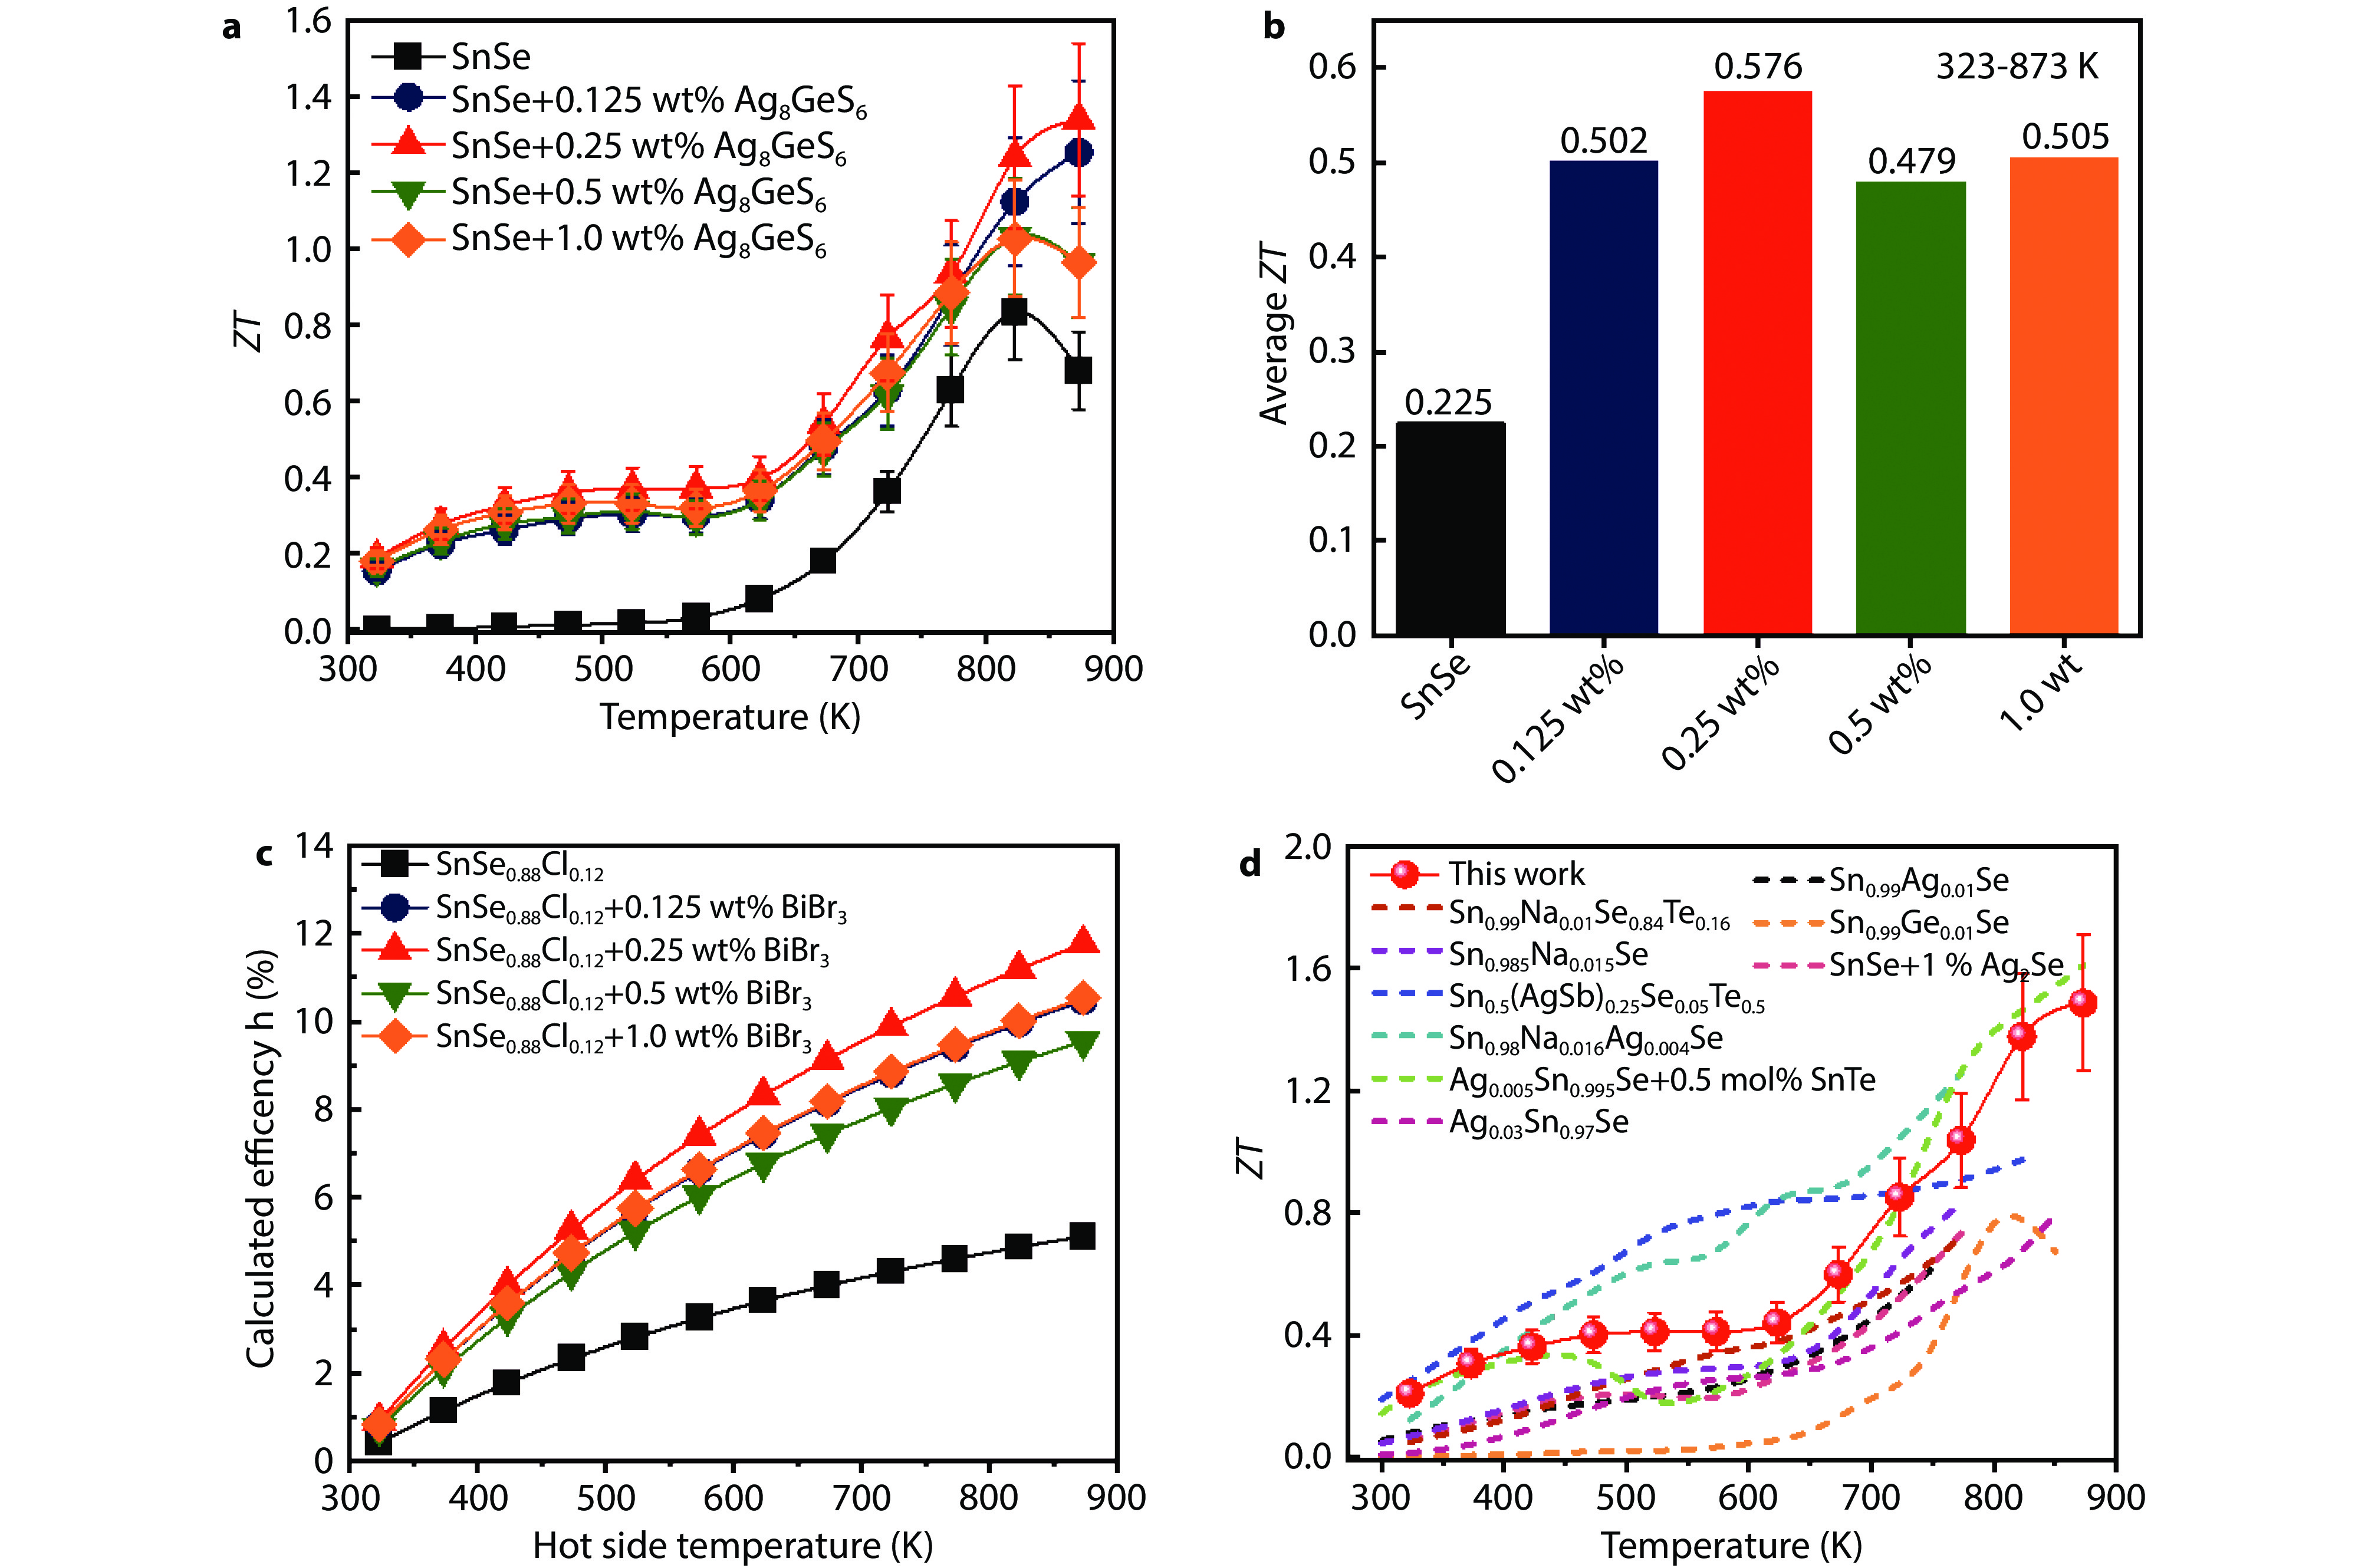
    Research on thermoelectric properties indicates that the electrical transport performance is improved and the thermal transport performance is maintained after doping Ag8GeS6 in doped SnSe. As illustrated in Fig. 7a-b, the sample infused with 0.25 weight percent Ag8GeS6 attained a maximum ZT value of 1.33 at 873 K, with an average ZT of 0.57 across the temperature range of 323-873 K. Compared with the majority of p-type optimizations for SnSe, there is a significant enhancement.[11,32,3541] As shown in Fig. 7c, We calculated the power generation conversion efficiency of all samples through theoretical simulations. With a cold end temperature of 298 K and a hot end temperature of 873 K, the sample doped with 0.25 weight percent achieved 11.7%. The enhancement of the performance will be favorable for the commercial application of polycrystalline SnSe in power generation field.

    Fig. 7  a Temperature dependence of ZT values, b average ZT values, c theoretical calculation of conversion efficiency for the SnSe + x wt% Ag8GeS6 (x = 0, 0.25, 0.5, 0.5, and 1.0) samples, and d ZT values in comparison with other p-type polycrystalline SnSe materials.

    P-type polycrystalline SnSe samples doped with Ag8GeS6 were fabricated through the combination of solid-state method and SPS technology, and the thermoelectric properties were investigated. The Ag elements that decomposed from Ag8GeS6 significantly enhances the electrical conductivity of SnSe materials by elevating the carrier concentration. The carrier concentration increases from 3.3×1017 cm−3 for the pristine sample to 8.7×1018 cm−3 for the SnSe doped with 0.25 weight percent Ag8GeS6. The SnSe sample doped with 0.25 weight percent Ag8GeS6 achieved a notable power factor value of 617 μW m−1 K−2 at 873 K. Meanwhile, doping Ag8GeS6 introduces multiple phonon-scattering mechanisms, including point defects, second phases, dislocations, and mass fluctuations, which ultimately sustain low thermal conductivity. Consequently, the SnSe doped with 0.25 weight percent Ag8GeS6 sample obtained a peak ZT value of 1.33 at 873 K and an average ZT value of 0.57 from 323 to 883 K, the theoretically calculated conversion efficiency reached 11.7%. In this study, the peak ZT and the average ZT within the entire testing temperature range of polycrystalline SnSe have been improved, thereby presenting the potential for the power generation application of polycrystalline SnSe.

    This work was supported by the Yunnan Science and Technology Program (202401AT070403), the Outstanding Youth Fund of Yunnan Province (Grant No.202201AV070005), the National Natural Science Foundation of China (Grant No.52162029), and the National Key R&D Program of China (Grant No. 2022YFF0503804).

  • The authors affirm that there are no conflicts of interest to disclose.

  • 1. L.-D. Zhao, M. G. Kanatzidis, J. Materiomics, 2016, 2, 101
    2. Y. Xiao, L.-D. Zhao, Science, 2020, 367, 1196
    3. B. Qin, M. G. Kanatzidis, L-D. Zhao, Science, 2024, 386, 285
    4. B. Qin, L.-D. Zhao, Science, 2022, 378, 832
    5. Z.-G. Chen, W.-D. Liu, J. Mater. Sci. Technol., 2022, 121, 256
    6. J. Peng, F. Ge, W. Han, T. Wu, J. Tang, Y. Li, C. Wang, J. Mater. Sci. Technol., 2025, 212, 272
    7. Z.-G. Chen, X. Shi, L.-D. Zhao, J. Zou, Prog. Mater Sci., 2018, 97, 283
    8. J. He, T. M. Tritt, Science, 2017, 357, 1369
    9. B. Jiang, W. Wang, S. Liu, Y. Wang, C. Wang, Y. Chen, L. Xie, M. Huang, J. He, Science, 2022, 377, 208
    10. F. Z. Zhang, D. Wu, J. He, Mat. Lab, 2022, 1, 220012
    11. Y.-P. Wang, B.-C. Qin, D.-Y. Wang, T. Hong, X. Gao, L.-D. Zhao, Rare Met., 2021, 40, 2819
    12. N. Xin, Y. Li, H. Shen, L. Shen, G. Tang, J. Materiomics, 2022, 8, 475
    13. Y. Qin, T. Xiong, J.-F. Zhu, Y.-L. Yang, H.-R. Ren, H.-L. He, C.-P. Niu, X.-H. Li, M.-Q. Xie, T. Zhao, J. Adv. Ceram., 2022, 11, 1671
    14. Y. Wu, X. Zhang, B. Wang, J. Liang, Z. Zhang, J. Yang, X. Dong, S. Zheng, H.-Z. Zhao, J. Mater. Sci. Technol., 2022, 101, 71
    15. Y.-X. Zhang, Q. Lou, Z.-H. Ge, S.-W. Gu, J.-X. Yang, J. Guo, Y.-K. Zhu, Y. Zhou, X.-H. Yu, J. Feng, J. He, Acta Mater., 2022, 233, 117972
    16. H. Hu, Y. Ju, J. Yu, Z. Wang, J. Pei, H.-C. Thong, J.-W. Li, B. Cai, F. Liu, Z. Han, B. Su, H.-L. Zhuang, Y. Jiang, H. Li, Q. Li, H. Zhao, B.-P. Zhang, J. Zhu, J.-F. Li, Nat. Mater., 2024, 23, 527
    17. C. Li, L. Wu, Y.-X. Zhang, J. Guo, J. Feng, Z.-H. Ge, Mat. Lab, 2022, 1, 220014
    18. C. Tang, D. Liang, H. Li, K. Luo, B. Zhang, J. Adv. Ceram., 2019, 8, 209
    19. Y.-X. Zhang, Q.-Y. Huang, X. Yan, C.-Y. Wang, T.-Y. Yang, Z.-Y. Wang, Y.-C. Shi, Q. Shan, J. Feng, Z.-H. Ge, Nat. Commun., 2024, 15, 2736
    20. C. Chang, M. Wu, D. He, Y. Pei, C.-F. Wu, X. Wu, H. Yu, F. Zhu, K. Wang, Y. Chen, L. Huang, J.-F. Li, J. He, L.-D. Zhao, Science, 2018, 360, 778
    21. L.-D. Zhao, C. Chang, G. Tan, M. G. Kanatzidis, Energy Environ. Sci., 2016, 9, 3044
    22. L. Zhang, J. Wang, Q. Sun, P. Qin, Z. Cheng, Z. Ge, Z. Li, S. Dou, Adv. Energy Mater., 2017, 7, 1700573
    23. H. Zhang, X. Liu, J. Wang, B. Zhang, J. Chen, L. Yang, G. Wang, M. Li, Y. Zheng, X. Zhou, G. Han, ACS Appl. Mater. Interfaces, 2021, 13, 37201
    24. Y. Gong, P. Ying, Q. Zhang, Y. Liu, X. Huang, W. Dou, Y. Zhang, D. Li, D. Zhang, T. Feng, M. Wang, G. Chen, G. Tang, Energy Environ. Sci., 2024, 17, 1612
    25. B. Qin, Y. Zhang, D. Wang, Q. Zhao, B. Gu, H. Wu, H. Zhang, B. Ye, S. J. Pennycook, L.-D. Zhao, J. Am. Chem. Soc., 2020, 142, 5901
    26. A. I. Pogodin, M. J. Filep, V. Y. Izai, O. P. Kokhan, P. Kúš, J. Phys. Chem. Solids, 2022, 168, 110828
    27. H. Liang, Q. Lou, Y.-K. Zhu, J. Guo, Z.-Y. Wang, S.-W. Gu, W. Yu, J. Feng, J. He, Z.-H. Ge, ACS Appl. Mater. Interfaces, 2021, 13, 45589
    28. Y. Yu, D.-S. He, S. Zhang, O. Cojocaru-Mirédin, T. Schwarz, A. Stoffers, X.-Y. Wang, S. Zheng, B. Zhu, C. Scheu, D. Wu, J.-Q. He, M. Wuttig, Z.-Y. Huang, F.-Q. Zu, Nano Energy, 2017, 37, 203
    29. P. Carruthers, Phys. Rev., 1959, 114, 995
    30. S. I. Kim, K. H. Lee, H. A. Mun, H. S. Kim, S. W. Hwang, J. W. Roh, D. J. Yang, W. H. Shin, X. S. Li, Y. H. Lee, G. J. Snyder, S. W. Kim, Science, 2015, 348, 109
    31. H. Leng, M. Zhou, J. Zhao, Y. Han, L. Li, J. Electron. Mater., 2016, 45, 527
    32. C.-L. Chen, H. Wang, Y.-Y. Chen, T. Day, G. J. Snyder, J. Mater. Chem. A, 2014, 2, 11171
    33. M. Cutler, N. F. Mott, Phys. Rev., 1969, 181, 1336
    34. J. Zhu, X. Zhang, M. Guo, J. Li, J. Hu, S. Cai, W. Cai, Y. Zhang, J. Sui, npj Comput. Mater., 2021, 7, 116
    35. T. A. Wubieneh, C.-L. Chen, P. C. Wei, S.-Y. Chen, Y.-Y. Chen, RSC Adv., 2016, 6, 114825
    36. T.-R. Wei, C.-F. Wu, X. Zhang, Q. Tan, L. Sun, Y. Pan, J.-F. Li, Phys. Chem. Chem. Phys., 2015, 17, 30102
    37. E. K. Chere, Q. Zhang, K. Dahal, F. Cao, J. Mao, Z. Ren, J. Mater. Chem. A, 2016, 4, 1848
    38. H. Wang, H. Hu, N. Man, C. Xiong, Y. Xiao, X. Tan, G. Liu, J. Jiang, Mater. Today Phys., 2021, 16, 100298
    39. C. Li, H. Wu, B. Zhang, H. Zhu, Y. Fan, X. Lu, X. Sun, X. Zhang, G. Wang, X. Zhou, ACS Appl. Mater. Interfaces, 2020, 12, 8446
    40. H. Guo, H. Xin, X. Qin, J. Zhang, D. Li, Y. Li, C. Song, C. Li, J. Alloys Compd., 2016, 689, 87
    41. C.-H. Chien, C.-C. Chang, C.-L. Chen, C.-M. Tseng, Y.-R. Wu, M.-K. Wu, C.-H. Lee, Y.-Y. Chen, RSC Adv., 2017, 7, 34300
  • This is an open access article under the terms of the Creative Commons Attribution License, which permits use, distribution and reproduction in any medium, provided the original work is properly cited.

通讯作者: 陈斌, bchen63@163.com
  • 1. 

    沈阳化工大学材料科学与工程学院 沈阳 110142

  1. 本站搜索
  2. 百度学术搜索
  3. 万方数据库搜索
  4. CNKI搜索

Figures(8)

Information

Article Metrics

Article views(401) PDF downloads(142) Citation(0)

Catalog

/

DownLoad:  Full-Size Img  PowerPoint